Chapter 4 The One-to-Many Relationship
Cow of many—well milked and badly fed.
Spanish proverb
Learning Objectives
Students completing this chapter will be able to
model a one-to-many relationship between two entities;
define a database with a one-to-many relationship;
write queries for a database with a one-to-many relationship.
Relationships
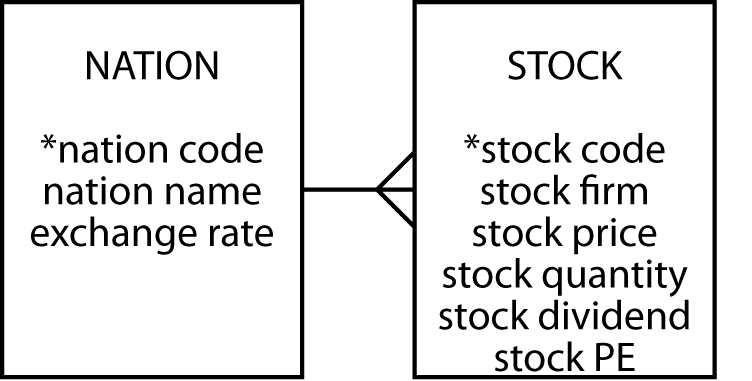
Entities are not isolated; they are related to other entities. When we move beyond the single entity, we need to identify the relationships between entities to accurately represent the real world. Consider the case where a person’s stocks are listed in different countries. We now need to introduce an entity called NATION. We now have two entities, STOCK and NATION. Consider the relationship between them. A NATION can have many listed stocks. A stock, in this case, is listed in only one nation. There is a 1:m (one-to-many) relationship between NATION and STOCK.
A 1:m relationship between two entities is depicted by a line connecting the two with a crow’s foot at the many end of the relationship. The following figure shows the 1:m relationship between NATION and STOCK. This can be read as: “a nation can have many stocks, but a stock belongs to only one nation.” The entity NATION is identified by nation code and has attributes nation name and exchange rate.
A 1:m relationship between NATION and STOCK
The 1:m relationship occurs frequently in business situations. Sometimes it occurs in a tree or hierarchical fashion. Consider a very hierarchical firm. It has many divisions, but a division belongs to only one firm. A division has many departments, but a department belongs to only one division. A department has many sections, but a section belongs to only one department.
A series of 1:m relationships

Why did we create an additional entity?
Another approach to adding data about listing nation and exchange rate is to add two attributes to STOCK: nation name and exchange rate. At first glance, this seems a very workable solution; however, this will introduce considerable redundancy, as the following table illustrates.
The table stock with additional columns
| *stkcode | stkfirm | stkprice | stkqty | stkdiv | stkpe | natname | exchrate |
|---|---|---|---|---|---|---|---|
| FC | Freedonia Copper | 27.5 | 10529 | 1.84 | 16 | United Kingdom | 1 |
| PT | Patagonian Tea | 55.25 | 12635 | 2.5 | 10 | United Kingdom | 1 |
| AR | Abyssinian Ruby | 31.82 | 22010 | 1.32 | 13 | United Kingdom | 1 |
| SLG | Sri Lankan Gold | 50.37 | 32868 | 2.68 | 16 | United Kingdom | 1 |
| ILZ | Indian Lead & Zinc | 37.75 | 6390 | 3 | 12 | United Kingdom | 1 |
| BE | Burmese Elephant | 0.07 | 154713 | 0.01 | 3 | United Kingdom | 1 |
| BS | Bolivian Sheep | 12.75 | 231678 | 1.78 | 11 | United Kingdom | 1 |
| NG | Nigerian Geese | 35 | 12323 | 1.68 | 10 | United Kingdom | 1 |
| CS | Canadian Sugar | 52.78 | 4716 | 2.5 | 15 | United Kingdom | 1 |
| ROF | Royal Ostrich Farms | 33.75 | 1234923 | 3 | 6 | United Kingdom | 1 |
| MG | Minnesota Gold | 53.87 | 816122 | 1 | 25 | USA | 0.67 |
| GP | Georgia Peach | 2.35 | 387333 | 0.2 | 5 | USA | 0.67 |
| NE | Narembeen Emu | 12.34 | 45619 | 1 | 8 | Australia | 0.46 |
| QD | Queensland Diamond | 6.73 | 89251 | 0.5 | 7 | Australia | 0.46 |
| IR | Indooroopilly Ruby | 15.92 | 56147 | 0.5 | 20 | Australia | 0.46 |
| BD | Bombay Duck | 25.55 | 167382 | 1 | 12 | India | 0.0228 |
The exact same nation name and exchange rate pair occurs 10 times for stocks listed in the United Kingdom. This redundancy presents problems when we want to insert, delete, or update data. These problems, generally known as update anomalies, occur with these three basic operations.
Insert anomalies
We cannot insert a fact about a nation’s exchange rate unless we first buy a stock that is listed in that nation. Consider the case where we want to keep a record of France’s exchange rate and we have no French stocks. We cannot skirt this problem by putting in a null entry for stock details because stkcode, the primary key, would be null, and this is not allowed. If we have a separate table for facts about a nation, then we can easily add new nations without having to buy stocks. This is particularly useful when other parts of the organization, say International Trading, also need access to exchange rates for many nations.
Delete anomalies
If we delete data about a particular stock, we might also lose a fact about exchange rates. For example, if we delete details of Bombay Duck, we also erase the Indian exchange rate.
Update anomalies
Exchange rates are volatile. Most companies need to update them every day. What happens when the Australian exchange rate changes? Every row in stock with nation = ‘Australia’ will have to be updated. In a large portfolio, many rows will be changed. There is also the danger of someone forgetting to update all the instances of the nation and exchange rate pair. As a result, there could be two exchange rates for the one nation. If exchange rate is stored in a nation table, however, only one change is necessary, there is no redundancy, and there is no danger of inconsistent exchange rates.
Creating a database with a 1:m relationship
As before, each entity becomes a table in a relational database, the entity name becomes the table name, each attribute becomes a column, and each identifier becomes a primary key. The 1:m relationship is mapped by adding a column to the entity at the many end of the relationship. The additional column contains the identifier of the one end of the relationship.
Consider the relationship between the entities STOCK and NATION. The database has two tables: stock and nation. The table stock has an additional column, natcode, which contains the primary key of nation. If natcode is not stored in stock, then there is no way of knowing the identity of the nation where the stock is listed.
A relational database with tables nation and stock
| nation | ||
|---|---|---|
| *natcode | natname | exchrate |
| AUS | Australia | 0.46 |
| IND | India | 0.0228 |
| UK | United Kingdom | 1 |
| USA | United States | 0.67 |
| stock | ||||||
|---|---|---|---|---|---|---|
| *stkcode | stkfirm | stkprice | stkqty | stkdiv | stkpe | natcode |
| FC | Freedonia Copper | 27.5 | 10,529 | 1.84 | 16 | UK |
| PT | Patagonian Tea | 55.25 | 12,635 | 2.5 | 10 | UK |
| AR | Abyssinian Ruby | 31.82 | 22,010 | 1.32 | 13 | UK |
| SLG | Sri Lankan Gold | 50.37 | 32,868 | 2.68 | 16 | UK |
| ILZ | Indian Lead & Zinc | 37.75 | 6,390 | 3 | 12 | UK |
| BE | Burmese Elephant | 0.07 | 154,713 | 0.01 | 3 | UK |
| BS | Bolivian Sheep | 12.75 | 231,678 | 1.78 | 11 | UK |
| NG | Nigerian Geese | 35 | 12,323 | 1.68 | 10 | UK |
| CS | Canadian Sugar | 52.78 | 4,716 | 2.5 | 15 | UK |
| ROF | Royal Ostrich Farms | 33.75 | 1,234,923 | 3 | 6 | UK |
| MG | Minnesota Gold | 53.87 | 816,122 | 1 | 25 | USA |
| GP | Georgia Peach | 2.35 | 387,333 | 0.2 | 5 | USA |
| NE | Narembeen Emu | 12.34 | 45,619 | 1 | 8 | AUS |
| QD | Queensland Diamond | 6.73 | 89,251 | 0.5 | 7 | AUS |
| IR | Indooroopilly Ruby | 15.92 | 56,147 | 0.5 | 20 | AUS |
| BD | Bombay Duck | 25.55 | 167,382 | 1 | 12 | IND |
Notice that natcode appears in both the stock and nation tables. In nation, natcode is the primary key; it is unique for each instance of nation. In table stock, natcode is a foreign key because it is the primary key of nation, the one end of the 1:m relationship. The column natcode is a foreign key in stock because it is a primary key in nation. A matched primary key–foreign key pair is the method for recording the 1:m relationship between the two tables. This method of representing a relationship is illustrated using shading and arrows for the two USA stocks. In the stock table, natcode is italicized to indicate that it is a foreign key. This method, like asterisking a primary key, is a useful reminder.
Although the same name has been used for the primary key and the foreign key in this example, it is not mandatory. The two columns can have different names, and in some cases you are forced to use different names. When possible, we find it convenient to use identical column names to help us remember that the tables are related. To distinguish between columns with identical names, they must by qualified by prefixing the table name. In this case, use nation.natcode and stock.natcode. Thus, nation.natcode refers to the natcode column in the table nation.
Although a nation can have many stocks, it is not mandatory to have any. That is, in data modeling terminology, many can be zero, one, or more, but it is mandatory to have a value for natcode in nation for every value of natcode in stock. This requirement, known as the referential integrity constraint, helps maintain the accuracy of a database. Its application means that every foreign key in a table has an identical primary key in that same table or another table. In this example, it means that for every value of natcode in stock, there is a corresponding entry in nation. As a result, a primary key row must be created before its corresponding foreign key row. In other words, details for a nation must be added before any data about its listed stocks are entered.
Every foreign key must have a matching primary key (referential integrity rule), and every primary key must be non-null (entity integrity rule). A foreign key cannot be null when a relationship is mandatory, as in the case where a stock must belong to a nation. If a relationship is optional (a person can have a boss), then a foreign key can be null (i.e., a person is the head of the organization, and thus has no boss). The ideas of mandatory and optional will be discussed later in this book.
Why is the foreign key in the table at the “many” end of the relationship? Because each instance of stock is associated with exactly one instance of nation. The rule is that a stock must be listed in one, and only one, nation. Thus, the foreign key field is single-valued when it is at the “many” end of a relationship. The foreign key is not at the “one” end of the relationship because each instance of nation can be associated with more than one instance of stock, and this implies a multivalued foreign key. The relational model does not support multivalued fields.
Using SQL, the two tables are defined in a similar manner to the way we created a single table in Chapter 3. Here are the SQL statements:
CREATE TABLE nation (
  natcode CHAR(3),
  natname VARCHAR(20),
  exchrate DECIMAL(9,5),
  PRIMARY KEY(natcode));
CREATE TABLE stock (
stkcode CHAR(3),
stkfirm VARCHAR(20),
stkprice DECIMAL(6,2),
stkqty DECIMAL(8),
stkdiv DECIMAL(5,2),
stkpe DECIMAL(5),
natcode CHAR(3),
PRIMARY KEY(stkcode),
CONSTRAINT fk_has_nation FOREIGN KEY(natcode)
REFERENCES nation(natcode) ON DELETE RESTRICT);Notice that the definition of stock includes an additional phrase to specify the foreign key and the referential integrity constraint. The CONSTRAINT clause defines the column or columns in the table being created that constitute the foreign key. A referential integrity constraint can be named, and in this case, the constraint’s name is fk_has_nation. The foreign key is the column natcode in STOCK, and it references the primary key of nation, which is natcode.
The ON DELETE clause specifies what processing should occur if an attempt is made to delete a row in nation with a primary key that is a foreign key in stock. In this case, the ON DELETE clause specifies that it is not permissible (the meaning of RESTRICT) to delete a primary key row in nation while a corresponding foreign key in stock exists. In other words, the system will not execute the delete. You must first delete all corresponding rows in stock before attempting to delete the row containing the primary key. ON DELETE is the default clause for most RDBMSs, so we will dispense with specifying it for future foreign key constraints.
Observe that both the primary and foreign keys are defined as CHAR(3). The relational model requires that a primary key–foreign key pair have the same data type and are the same length.
❓ Skill builder
The university architect has asked you to develop a data model to record details of campus buildings. A building can have many rooms, but a room can be in only one building. Buildings have names, and rooms have a size and purpose (e.g., lecture, laboratory, seminar). Draw a data model for this situation and create the matching relational database.
MySQL Workbench
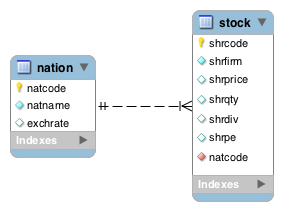
In Workbench, a 1:m relationship is represented in a similar manner to the method you have just learned. Also, note that the foreign key is shown in the entity at the many end with a red diamond. We omit the foreign key when data modeling because it can be inferred. You will observe some additional symbols on the line between the two entities, and these will be explained later, but take note of the crow’s foot indicating the 1:m relationship between nation and stock. Because Workbench can generate automatically the SQL to create the tables,18 we use lowercase table names and abbreviated column names.
Specifying a 1:m relationship in MySQL Workbench
Querying a two-table database
A two-table database offers the opportunity to learn more SQL and another relational algebra operation: join.
Join
Join creates a new table from two existing tables by matching on a column common to both tables. Usually, the common column is a primary key–foreign key pair: The primary key of one table is matched with the foreign key of another table. Join is frequently used to get the data for a query into a single row. Consider the tables nation and stock. If we want to calculate the value—in British pounds—of a stock, we multiply stock price by stock quantity and then exchange rate. To find the appropriate exchange rate for a stock, get its natcode from stock and then find the exchange rate in the matching row in nation, the one with the same value for natcode. For example, to calculate the value of Georgia Peach, which has natcode = ‘US’, find the row in nation that also has natcode = ‘US’. In this case, the stock’s value is 2.35 * 387333 / 0.67 = £609,855.81.
Calculation of stock value is very easy once a join is used to get the three values in one row. The SQL command for joining the two tables is:
| stkcode | stkfirm | stkprice | stkqty | stkdiv | stkpe | natcode | natcode | natname | exchrate |
|---|---|---|---|---|---|---|---|---|---|
| IR | Indooroopilly Ruby | 15.92 | 56147 | 0.50 | 20 | AUS | AUS | Australia | 0.4600 |
| NE | Narembeen Emu | 12.34 | 45619 | 1.00 | 8 | AUS | AUS | Australia | 0.4600 |
| QD | Queensland Diamond | 6.73 | 89251 | 0.50 | 7 | AUS | AUS | Australia | 0.4600 |
| BD | Bombay Duck | 25.55 | 167382 | 1.00 | 12 | IND | IND | India | 0.0228 |
| AR | Abyssinian Ruby | 31.82 | 22010 | 1.32 | 13 | UK | UK | United Kingdom | 1.0000 |
| BE | Burmese Elephant | 0.07 | 154713 | 0.01 | 3 | UK | UK | United Kingdom | 1.0000 |
| BS | Bolivian Sheep | 12.75 | 231678 | 1.78 | 11 | UK | UK | United Kingdom | 1.0000 |
| CS | Canadian Sugar | 52.78 | 4716 | 2.50 | 15 | UK | UK | United Kingdom | 1.0000 |
| FC | Freedonia Copper | 27.50 | 10529 | 1.84 | 16 | UK | UK | United Kingdom | 1.0000 |
| ILZ | Indian Lead & Zinc | 37.75 | 6390 | 3.00 | 12 | UK | UK | United Kingdom | 1.0000 |
The join of stock and nation
The columns stkprice and stkdiv record values in the country’s currency. Thus, the price of Bombay Duck is 25.55 Indian rupees. To find the value in U.K. pounds (GPB), multiply the price by 0.0228, because one rupee is worth 0.0228 GPB. The value of one share of Bombay Duck in U.S. dollars (USD) is 25.55 * 0.0228 / 0.67 because one USD is worth 0.67 GBP.
There are several things to notice about the SQL command and the result:
To avoid confusion because
natcodeis a column name in both stock and nation, it needs to be qualified. Ifnatcodeis not qualified, the system will reject the query because it cannot distinguish between the two columns titlednatcode.The new table has the
natcodecolumn replicated. Both are callednatcode. The naming convention for the replicated column varies with the RDBMS. The columns, for example, should be labeledstock.natcodeandnation.natcode.The SQL command specifies the names of the tables to be joined, the columns to be used for matching, and the condition for the match (equality in this case).
The number of columns in the new table is the sum of the columns in the two tables.
The stock value calculation is now easily specified in an SQL command because all the data are in one row.
Remember that during data modeling we created two entities, STOCK and NATION, and defined the relationship between them. We showed that if the data were stored in one table, there could be updating problems. Now, with a join, we have combined these data. So why separate the data only to put them back together later? There are two reasons. First, we want to avoid update anomalies. Second, as you will discover, we do not join the same tables every time.
Join comes in several flavors. The matching condition can be =, <>, <=, <, >=, and >. This generalized version is called a theta join. Generally, when people refer to a join, they mean an equijoin, when the matching condition is equality.
A join can be combined with other SQL commands.
Report the value of each stockholding in UK pounds. Sort the report by nation and firm.
SELECT natname, stkfirm, stkprice, stkqty, exchrate,
    stkprice*stkqty*exchrate as stkvalue
        FROM stock JOIN nation
            ON stock.natcode = nation.natcode
ORDER BY natname, stkfirm;| natname | stkfirm | stkprice | stkqty | exchrate | stkvalue |
|---|---|---|---|---|---|
| Australia | Indooroopilly Ruby | 15.92 | 56147 | 0.4600 | 411175.71 |
| Australia | Narembeen Emu | 12.34 | 45619 | 0.4600 | 258951.69 |
| Australia | Queensland Diamond | 6.73 | 89251 | 0.4600 | 276303.25 |
| India | Bombay Duck | 25.55 | 167382 | 0.0228 | 97506.71 |
| United Kingdom | Abyssinian Ruby | 31.82 | 22010 | 1.0000 | 700358.20 |
| United Kingdom | Bolivian Sheep | 12.75 | 231678 | 1.0000 | 2953894.50 |
| United Kingdom | Burmese Elephant | 0.07 | 154713 | 1.0000 | 10829.91 |
| United Kingdom | Canadian Sugar | 52.78 | 4716 | 1.0000 | 248910.48 |
| United Kingdom | Freedonia Copper | 27.50 | 10529 | 1.0000 | 289547.50 |
| United Kingdom | Indian Lead & Zinc | 37.75 | 6390 | 1.0000 | 241222.50 |
Control break reporting
The purpose of a join is to collect the necessary data for a report. When two tables in a 1:m relationship are joined, the report will contain repetitive data. If you re-examine the report from the previous join, you will see that nation and exchrate are often repeated because the same values apply to many stocks. A more appropriate format is shown in the following figure, an example of a control break report.
| Nation | Exchange rate | ||||
|---|---|---|---|---|---|
| Firm | Price | Quantity | Value | ||
| Australia | 0.46 | ||||
| Indooroopilly Ruby | 15.92 | 56,147 | 411,175.71 | ||
| Narembeen Emu | 12.34 | 45,619 | 258,951.69 | ||
| Queensland Diamond | 6.73 | 89,251 | 276,303.25 | ||
| India | 0.0228 | ||||
| Bombay Duck | 25.55 | 167,382 | 97,506.71 | ||
| United Kingdom | 0.0228 | ||||
| Abyssinian Ruby | 31.82 | 22,010 | 700,358.20 | ||
| Bolivian Sheep | 12.75 | 231,678 | 2,953,894.50 | ||
| Burmese Elephant | 0.07 | 154,713 | 10,829.91 | ||
| Canadian Sugar | 52.78 | 4,716 | 248,910.48 | ||
| Freedonia Copper | 27.50 | 10,529 | 289,547.50 | ||
| Indian Lead & Zinc | 37.75 | 6,390 | 241,222.50 | ||
| Nigerian Geese | 35.00 | 12,323 | 431,305.00 | ||
| Patagonian Tea | 55.25 | 12,635 | 698,083.75 | ||
| Royal Ostrich Farms | 33.75 | 1,234,923 | 41,678,651.25 | ||
| Sri Lankan Gold | 50.37 | 32,868 | 1,655,561.16 | ||
| United States | 0.0228 | ||||
| Georgia Peach | 2.35 | 387,333 | 609,855.81 | ||
| Minnesota Gold | 53.87 | 816,122 | 29,456,209.73 |
A control break report recognizes that the values in a particular column or columns seldom change. In this case, natname and exchrate are often the same from one row to the next, so it makes sense to report these data only when they change. The report is also easier to read. The column natname is known as a control field. Notice that there are four groups of data, because natname has four different values.
Many RDBMS packages have report-writing languages to facilitate creating a control break report. These languages typically support summary reporting for each group of rows having the same value for the control field(s). A table must usually be sorted on the control break field(s) before the report is created.
GROUP BY—reporting by groups
The GROUP BY clause is an elementary form of control break reporting. It permits grouping of rows that have the same value for a specified column or columns, and it produces one row for each different value of the grouping column(s).
Report by nation the total value of stockholdings.
SELECT natname, sum(stkprice*stkqty*exchrate) as stkvalue
    FROM stock JOIN nation ON stock.natcode = nation.natcode
GROUP BY natname;| natname | stkvalue |
|---|---|
| Australia | 946430.65 |
| India | 97506.71 |
| United Kingdom | 48908364.25 |
| United States | 30066065.54 |
SQL’s built-in functions (COUNT, SUM, AVERAGE, MIN, and MAX) can be used with the GROUP BY clause. They are applied to a group of rows having the same value for a specified column. You can specify more than one function in a SELECT statement. For example, we can compute total value and number of different stocks and group by nation using:
Report the number of stocks and their total value by nation.
SELECT natname, COUNT(*), SUM(stkprice*stkqty*exchrate) AS stkvalue
    FROM stock JOIN nation ON stock.natcode = nation.natcode
GROUP BY natname;| natname | COUNT(*) | stkvalue |
|---|---|---|
| Australia | 3 | 946430.65 |
| India | 1 | 97506.71 |
| United Kingdom | 10 | 48908364.25 |
| United States | 2 | 30066065.54 |
You can group by more than one column name; however, all column names appearing in the SELECT clause must be associated with a built-in function or be in a GROUP BY clause.
List stocks by nation, and for each nation show the number of stocks for each PE ratio and the total value of those stock holdings in UK pounds.
SELECT natname,stkpe,COUNT(*),
    SUM(stkprice*stkqty*exchrate) AS stkvalue
        FROM stock JOIN nation ON stock.natcode = nation.natcode
GROUP BY natname, stkpe;| natname | stkpe | COUNT(*) | stkvalue |
|---|---|---|---|
| Australia | 20 | 1 | 411175.71 |
| Australia | 8 | 1 | 258951.69 |
| Australia | 7 | 1 | 276303.25 |
| India | 12 | 1 | 97506.71 |
| United Kingdom | 13 | 1 | 700358.20 |
| United Kingdom | 3 | 1 | 10829.91 |
| United Kingdom | 11 | 1 | 2953894.50 |
| United Kingdom | 15 | 1 | 248910.48 |
| United Kingdom | 16 | 2 | 1945108.66 |
| United Kingdom | 12 | 1 | 241222.50 |
| United Kingdom | 10 | 2 | 1129388.75 |
| United Kingdom | 6 | 1 | 41678651.25 |
| United States | 5 | 1 | 609855.81 |
| United States | 25 | 1 | 29456209.73 |
In this example, stocks are grouped by both natname and stkpe. In most cases, there is only one stock for each pair of natname and stkpe; however, there are two situations (U.K. stocks with PEs of 10 and 16) where details of multiple stocks are grouped into one report line. Examining the values in the COUNT column helps you to identify these stocks.
HAVING—the WHERE clause of groups
The HAVING clause in a GROUP BY is like the WHERE clause in a SELECT. It restricts the number of groups reported, whereas WHERE restricts the number of rows reported. Used with built-in functions, HAVING is always preceded by GROUP BY and is always followed by a function (SUM, AVG, MAX, MIN, or COUNT).
Report the total value of stocks for nations with two or more listed stocks.
SELECT natname, SUM(stkprice*stkqty*exchrate) AS stkvalue
    FROM stock JOIN nation ON stock.natcode = nation.natcode
        GROUP BY natname
HAVING COUNT(*) >= 2;| natname | stkvalue |
|---|---|
| Australia | 946430.6 |
| United Kingdom | 48908364.2 |
| United States | 30066065.5 |
❓ Skill builder
Report by nation the total value of dividends.
Regular expression—pattern matching
Regular expression was introduced in the previous chapter, and we will now continue to learn some more of its features.
Search for a string not containing specified characters
The ^ (carat) is the symbol for NOT. It is used when we want to find a string not containing a character in one or more specified strings. For example, [^a-f] means any character not in the set containing a, b, c, d, e, or f.
List the names of nations with non-alphabetic characters in their names
| natname |
|---|
| United Kingdom |
| United States |
Notice that the nations reported have a space in their name, which is a character not in the range a-z.
Search for string containing a repeated pattern or repetition
A pair of curly brackets is used to denote the repetition factor for a pattern. For example, {n} means repeat a specified pattern n times.
List the names of firms with a double lower case ‘e’.
| stkfirm |
|---|
| Bolivian Sheep |
| Freedonia Copper |
| Narembeen Emu |
| Nigerian Geese |
| Queensland Diamond |
Search combining alternation and repetition
Regular expressions becomes very powerful when you combine several of the basic capabilities into a single search expression.
List the names of firms with a double ‘s’ or a double ‘n’.
| stkfirm |
|---|
| Abyssinian Ruby |
| Minnesota Gold |
Search for multiple versions of a string
If you are interested in find a string containing several specified string, you can use the square brackets to indicate the sought strings. For example, [ea] means any character from the set containing e and a.
List the names of firms with names that include ‘inia’ or ‘onia’.
| stkfirm |
|---|
| Abyssinian Ruby |
| Freedonia Copper |
| Patagonian Tea |
Search for a string in a particular position
Sometimes you might be interested in identifying a string with a character in a particular position.
Find firms with ‘t’ as the third letter of their name.
| stkfirm |
|---|
| Patagonian Tea |
The regular expression has three elements:
^ indicates start searching at the beginning of the string;
(.){2} specifies that anything is acceptable for the next two characters;
t indicates what the next character, the third, must be.
Search for a string not containing any specified characters
There might be a need to find rows not containing specified characters anywhere in a givev coumn. You need to check every character in the string to ensure there are matches.
List the names of nations without s or S anywhere in their names
| natcode | natname | exchrate |
|---|---|---|
| IND | India | 0.0228 |
| UK | United Kingdom | 1.0000 |
- ^ start searching at the beginning of the string;
- $ end searching at the end of the string;
- * any character in a string;
- ^s no lower case s (remember you have converted natname to all lowercase)
You have seen a few of the features of a very powerful tool. To learn more about regular expressions, see regexlib.com, which contains a library of regular expressions and a feature for finding expressions to solve specific problems. Check out the regular expression for checking whether a character string is a valid email address.
Subqueries
A subquery, or nested SELECT, is a SELECT nested within another SELECT. A subquery can be used to return a list of values subsequently searched with an IN clause.
Report the names of all Australian stocks.
SELECT stkfirm FROM stock
    WHERE natcode IN
        (SELECT natcode FROM nation
WHERE natname = 'Australia');| stkfirm |
|---|
| Indooroopilly Ruby |
| Narembeen Emu |
| Queensland Diamond |
Conceptually, the subquery is evaluated first. It returns a list of values for natcode (‘AUS’) so that the query then is the same as:
When discussing subqueries, sometimes a subquery is also called an inner query. The term outer query is applied to the SQL preceding the inner query. In this case, the outer and inner queries are:
| Outer query | SELECT stkfirm FROM stock WHERE natcode IN |
| Inner query | (SELECT natcode FROM nation WHERE natname = ‘Australia’); |
Note that in this case we do not have to qualify natcode. There is no identity crisis, because natcode in the inner query is implicitly qualified as nation.natcode and natcode in the outer query is understood to be stock.natcode.
This query also can be run as a join by writing:
Views—virtual tables
You might have noticed that in these examples we repeated the join and stock value calculation for each query. Ideally, we should do this once, store the result, and be able to use it with other queries. We can do so if we create a view, a virtual table. A view does not physically exist as stored data; it is an imaginary table constructed from existing tables as required. You can treat a view as if it were a table and write SQL to query it.
A view contains selected columns from one or more tables. The selected columns can be renamed and rearranged. New columns based on arithmetic expressions can be created. GROUP BY can also be used when creating a view. Remember, a view contains no actual data. It is a virtual table.
This SQL command does the join, calculates stock value, and saves the result as a view:
CREATE VIEW stkvalue
    (nation, firm, price, qty, exchrate, value)
    AS SELECT natname, stkfirm, stkprice, stkqty, exchrate,
        stkprice*stkqty*exchrate
            FROM stock JOIN nation
            ON stock.natcode = nation.natcode;
There are several things to notice about creating a view:
- The six names enclosed in parentheses are the column names for the view.
- There is a one-to-one correspondence between the names in parentheses and the names or expressions in the SELECT clause. Thus the view column named
valuecontains the result of the arithmetic expressionstkprice * stkqty * exchrate.
A view can be used in a query, such as:
Find stocks with a value greater than £100,000.
| nation | firm | value |
|---|---|---|
| Australia | Indooroopilly Ruby | 411175.7 |
| Australia | Narembeen Emu | 258951.7 |
| Australia | Queensland Diamond | 276303.2 |
| United Kingdom | Abyssinian Ruby | 700358.2 |
| United Kingdom | Bolivian Sheep | 2953894.5 |
| United Kingdom | Canadian Sugar | 248910.5 |
| United Kingdom | Freedonia Copper | 289547.5 |
| United Kingdom | Indian Lead & Zinc | 241222.5 |
| United Kingdom | Nigerian Geese | 431305.0 |
| United Kingdom | Patagonian Tea | 698083.8 |
There are two main reasons for creating a view. First, as we have seen, query writing can be simplified. If you find that you are frequently writing the same section of code for a variety of queries, then isolate the common section and put it in a view. This means that you will usually create a view when a fact, such as stock value, is derived from other facts in the table.
The second reason is to restrict access to certain columns or rows. For example, the person who updates stock could be given a view that excludes stkqty. In this case, changes in stock prices could be updated without revealing confidential information, such as the value of the stock portfolio.
❓ Skill builder
How could you use a view to solve the following query that was used when discussing the correlated subquery?
Find those stocks where the quantity is greater than the average for that country.
Summary
Entities are related to other entities by relationships. The 1:m (one-to-many) relationship occurs frequently in data models. An additional entity is required to represent a 1:m relationship to avoid update anomalies. In a relational database, a 1:m relationship is represented by an additional column, the foreign key, in the table at the many end of the relationship. The referential integrity constraint insists that a foreign key must always exist as a primary key in a table. A foreign key constraint is specified in a CREATE statement.
Join creates a new table from two existing tables by matching on a column common to both tables. Often the common column is a primary key–foreign key combination. A theta-join can have matching conditions of =, <>, <=, <, >=, and >. An equijoin describes the situation where the matching condition is equality. The GROUP BY clause is used to create an elementary control break report. The HAVING clause of GROUP BY is like the WHERE clause of SELECT. A subquery, which has a SELECT statement within another SELECT statement, causes two SELECT statements to be executed—one for the inner query and one for the outer query. A correlated subquery is executed as many times as there are rows selected by the outer query. A view is a virtual table that is created when required. Views can simplify report writing and restrict access to specified columns or rows.
Exercises
Draw data models for the following situations. In each case, make certain that you show the attributes and feasible identifiers:
A farmer can have many cows, but a cow belongs to only one farmer.
A university has many students, and a student can attend at most one university.
An aircraft can have many passengers, but a passenger can be on only one flight at a time.
A nation can have many states and a state many cities.
An art researcher has asked you to design a database to record details of artists and the museums in which their paintings are displayed. For each painting, the researcher wants to know the size of the canvas, year painted, title, and style. The nationality, date of birth, and death of each artist must be recorded. For each museum, record details of its location and specialty, if it has one.
Report all values in British pounds:
Report the value of stocks listed in Australia.
Report the dividend payment of all stocks.
Report the total dividend payment by nation.
Create a view containing nation, firm, price, quantity, exchange rate, value, and yield.
Report the average yield by nation.
Report the minimum and maximum yield for each nation.
Report the nations where the average yield of stocks exceeds the average yield of all stocks.
How would you change the queries in exercise 4-2 if you were required to report the values in American dollars, Australian dollars, or Indian rupees?
What is a foreign key and what role does it serve?
What is the referential integrity constraint? Why should it be enforced?
Kisha, against the advice of her friends, is simultaneously studying data management and Shakespearean drama. She thought the two subjects would be an interesting contrast. However, the classes are very demanding and often enter her midsummer dreams. Last night, she dreamed that William Shakespeare wanted her to draw a data model. He explained, before she woke up in a cold sweat, that a play had many characters but the same character never appeared in more than one play. “Methinks,” he said, “the same name may have appeareth more than the once, but ’twas always a person of a different ilk.” He then, she hazily recollects, went on to spout about the quality of data dropping like the gentle rain. Draw a data model to keep old Bill quiet and help Kisha get some sleep.
An orchestra has four broad classes of instruments (strings, woodwinds, brass, and percussion). Each class contains musicians who play different instruments. For example, the strings section of a full symphony orchestra contains 2 harps, 16 to 18 first violins, 14 to 16 second violins, 12 violas, 10 cellos, and 8 double basses. A city has asked you to develop a database to store details of the musicians in its three orchestras. All the musicians are specialists and play only one instrument for one orchestra.
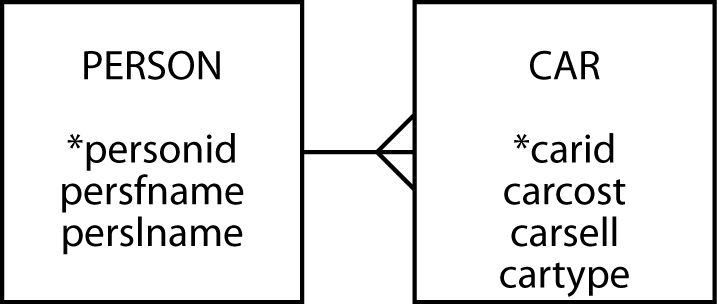
Answer the following queries based on the following database for a car dealer:
What is the personid of Sheila O’Hara?
List sales personnel sorted by last name and within last name, first name.
List details of the sales made by Bruce Bush.
List details of all sales showing the gross profit (selling price minus cost price).
Report the number of cars sold of each type.
What is the average selling price of cars sold by Sue Lim?
Report details of all sales where the gross profit is less than the average.
What was the maximum selling price of any car?
What is the total gross profit?
Report the gross profit made by each salesperson who sold at least three cars.
Create a view containing all the details in the car table and the gross profit
Find stocks where the third or fourth letter in their name is an ‘m’.
An electricity supply company needs a database to record details of solar panels installed on its customers’ homes so it can estimate how much solar energy will be generated based on the forecast level of solar radiation for each house’s location. A solar panel has an area, measured in square meters, and an efficiency expressed as a percentage (e.g., 22% efficiency means that 22% of the incident solar energy is converted into electrical energy). Create a data model. How will you identify each customer and each panel?
Database > Forward Engineer…↩︎