Chapter 7 Data Modeling
Man is a knot, a web, a mesh into which relationships are tied. Only those relationships matter.
Antoine de Saint-Exupéry in Flight to Arras
Learning objectives
Students completing this chapter will be able to create a well-formed, high-fidelity data model.
Modeling
Modeling is widely used within business to learn about organizational problems and design solutions. To understand where data modeling fits within the broader context, it is useful to review the full range of modeling activities. The types of modeling methods follow the 5W-H model of journalism.21
A broad perspective on modeling
| Scope | Model | Technology | ||
|---|---|---|---|---|
| Motivation | Why | Goals | Business plan canvas | Groupware |
| People | Who | Business units | Organization chart | System interface |
| Time | When | Key events | PERT chart | Scheduling |
| Data | What | Key entities | Data model | Relational database |
| Network | Where | Locations | Logistics network | System architecture |
| Function | How | Key processes | Process model | Application software |
Modeling occurs at multiple levels. At the highest level, an organization needs to determine the scope of its business by identifying the major elements of its environment, such as its goals, business units, where it operates, and critical events, entities, and processes. At the top level, textual models are frequently used. For example, an organization might list its major goals and business processes. A map will be typically used to display where the business operates.
Once senior managers have clarified the scope of a business, models can be constructed for each of the major elements. Goals will be converted into a business plan, business units will be shown on an organizational chart, and so on. The key elements, from an IS perspective, are data and process modeling, which are typically covered in the core courses of an IS program.
Technology, the final stage, converts models into operational systems to support the organization. Many organizations rely extensively on email and Web technology for communicating business decisions. People connect to systems through an interface, such as a Web browser. Ensuring that events occur at the right time is managed by scheduling software. This could be implemented with operating system procedures that schedule the execution of applications. In some database management systems (DBMSs), triggers can be established. A trigger is a database procedure that is automatically executed when some event is recognized. For example, U.S. banks are required to report all deposits exceeding USD 10,000, and a trigger could be coded for this event.
Data models are typically converted into relational databases, and process models become computer programs. Thus, you can see that data modeling is one element of a comprehensive modeling activity that is often required to design business systems. When a business undergoes a major change, such as a reengineering project, many dimensions can be altered, and it may be appropriate to rethink many elements of the business, starting with its goals. Because such major change is very disruptive and costly, it occurs less frequently. It is more likely that data modeling is conducted as a stand-alone activity or part of process modeling to create a new business application.
Data modeling
You were introduced to the basic building blocks of data modeling in the earlier chapters of this section. Now it is time to learn how to assemble blocks to build a data model. Data modeling is a method for determining what data and relationships should be stored in the database. It is also a way of communicating a database design.
The goal of data modeling is to identify the facts that must be stored in a database. A data model is not concerned with how the data will be stored. This is the concern of those who implement the database. A data model is not concerned with how the data will be processed. This is the province of process modeling. The goal is to create a data model that is an accurate representation of data needs and real-world data relationships.
Building a data model is a partnership between a client, a representative of the eventual owners of the database, and a designer. Of course, there can be a team of clients and designers. For simplicity, we assume there is one client and one designer.
Drawing a data model is an iterative process of trial and revision. A data model is a working document that will change as you learn more about the client’s needs and world. Your early versions are likely to be quite different from the final product. Use a product, such as MySQL Workbench, for drawing and revising a data model.
The building blocks
The purpose of a database is to store data about things, which can include facts (e.g., an exchange rate), plans (e.g., scheduled production of two-person tents for June), estimates (e.g., forecast of demand for smart phones), and a variety of other data. A data model describes these things and their relationships with other things using four components: entity, attribute, relationship, and identifier.
Entity
The entity is the basic building block of a data model. An entity is a thing about which data should be stored, something we need to describe. Each entity in a data model has a unique name that we write in singular form. Why singular? Because we want to emphasize that an entity describes an instance of a thing. Thus, we previously used the word SHARE to define an entity because it describes each instance of a share rather than shares in general.
We have already introduced the convention that an entity is represented by a rectangle, and the name of the entity is shown in uppercase letters, as follows.
The entity SHARE

A large data model might contain over a 1,000 entities. A database can easily contain hundreds of millions of instances (rows) for any one entity (table). Imagine the number of instances in a national tax department’s database.
How do you begin to identify entities? One approach is to underline any nouns in the system proposal or provided documentation. Most nouns are possible entities, and underlining ensures that you do not overlook any potential entities. Start by selecting an entity that seems central to the problem. If you were designing a student database, you might start with the student. Once you have picked a central entity, describe it. Then move to the others.
Attribute
An attribute describes an entity. When an entity has been identified, the next step is to determine its attributes, that is, the data that should be kept to describe fully the entity. An attribute name is singular and unique within the data model. You may need to use a modifier to make an attribute name unique (e.g., “hire date” and “sale date” rather than just “date”).
Our convention is that the name of an attribute is recorded in lowercase letters within the entity rectangle. The following figure illustrates that SHARE has attributes share code, share name, share price, share quantity, share dividend, and share PE. Notice the frequent use of the modifier “share”. It is possible that other entities in the database might also have a price and quantity, so we use a modifier to create unique attribute names. Note also that share code is the identifier.
The entity SHARE with its attributes

Defining attributes generally takes considerable discussion with the client. You should include any attribute that is likely to be required for present or future decision making, but don’t get carried away. Avoid storing unnecessary data. For example, to describe the entity STUDENT you usually record date of birth, but it is unlikely that you would store height. If you were describing an entity PATIENT, on the other hand, it might be necessary to record height, because that is sometimes relevant to medical decision making.
An attribute has a single value, which may be null. Multiple values are not allowed. If you need to store multiple values, it is a signal that you have a one-to-many (1:m) relationship and need to define another entity.
Relationship
Entities are related to other entities. If there were no relationships between entities, there would be no need for a data model and no need for a relational database. A simple, flat file (a single-entity database) would be sufficient. A relationship is binary. It describes a linkage between two entities and is represented by a line between them.
Because a relationship is binary, strictly speaking it has two relationship descriptors, one for each entity. Each relationship descriptor has a degree stating how many instances of the other entity may be related to each instance of the described entity. Consider the entities STOCK and NATION and their 1:m relationship (see the following figure). We have two relationship descriptors: stocks of nation for NATION and nation of stock for STOCK. The relationship descriptor stocks of nation has a degree of m because a nation may have zero or more listed stocks. The relationship descriptor nation of stock has a degree of 1 because a stock is listed in at most one nation. To reduce data model clutter, where necessary for clarification, use a single label for the pair of relationship descriptors. Experience shows this approach captures the meaning of the relationship and improves readability.
A 1:m relationship between STOCK and NATION

Because the meaning of relationships frequently can be inferred, there is no need to label every one; however, each additional relationship between two entities should be labeled to clarify meaning. Also, it is a good idea to label one-to-one (1:1) relationships, because the meaning of the relationship is not always obvious.
Consider the fragment in the following figure. The descriptors of the 1:m relationship can be inferred as a firm has employees and an employee belongs to a firm. the 1:1 relationship is clarified by labeling the 1:1 relationship as firm’s boss.
Relationship labeling

Identifier
An identifier uniquely distinguishes an instance of an entity. An identifier can be one or more attributes and may include the identifier of a related entity. When a related entity’s identifier is part of an identifier, a plus sign is placed above the line closest to the entity being identified. In the following figure, an instance of the entity LINEITEM is identified by the composite of lineno and saleno, the identifier of SALE. The value lineno does not uniquely identify an instance of LINEITEM, because it is simply a number that appears on the sales form. Thus, the identifier must include saleno (the identifier of SALE). So, any instance of LINEITEM is uniquely identified by the composite saleno and lineno.
A related entity’s identifier as part of the identifier

Occasionally, there will be several possible identifiers, and these are each given a different symbol. Our convention is to prefix an identifier with an asterisk (*). If there are multiple identifiers, use other symbols such as #, !, or &. Be careful: If you have too many possible identifiers, your model will look like comic book swearing. In most cases, you will have only one identifier.
No part of an identifier can be null. If this were permitted, there would be no guarantee that the other parts of the identifier were sufficiently unique to distinguish all instances in the database.
Data model quality
There are two criteria for judging the quality of a data model. It must be well-formed and have high fidelity.
A well-formed data model
A well-formed data model clearly communicates information to the client. Being well-formed means the construction rules have been obeyed. There is no ambiguity; all entities are named, and all entities have identifiers. If identifiers are missing, the client may make incorrect inferences about the data model. All relationships are recorded using the proper notation and labeled whenever there is a possibility of confusion.
Characteristics of a well-formed data model
| All construction rules are obeyed. |
| There is no ambiguity. |
| All entities are named. |
| Every entity has an identifier. |
| All relationships are represented, using the correct notation. |
| Relationships are labeled to avoid misunderstanding. |
| All attributes of each entity are listed. |
| All attribute names are meaningful and unique. |
All the attributes of an entity are listed because missing attributes create two types of problems. First, it is unclear what data will be stored about each instance. Second, the data model may be missing some relationships. Attributes that can have multiple values become entities. It is only by listing all of an entity’s attributes during data modeling that these additional entities are recognized.
In a well-formed data model, all attribute names are meaningful and unique. The names of entities, identifiers, attributes, and relationships must be meaningful to the client because they are describe the client’s world. Indeed, in nearly all cases they should be the client’s everyday names. Take care in selecting words because they are critical to communicating meaning. The acid test for comprehension is to get the client to read the data model to other potential clients. Names need to be unique to avoid confusion.
A high-fidelity image
Music lovers aspire to own a high-fidelity stereo system—one that faithfully reproduces the original performance with minimal or no distortion. A data model is high-fidelity when it faithfully describes the world it is supposed to represent. All relationships are recorded and are of the correct degree. There are no compromises or distortions. If the real-world relationship is many-to-many (m:m), then so is the relationship shown in the data model. a well-formed, high-fidelity data model is complete, understandable, accurate, and syntactically correct.
Quality improvement
A data model is an evolving representation. Each change should be an incremental improvement in quality. Occasionally, you will find a major quality problem at the data model’s core and have to change the model considerably.
Detail and context
The quality of a data model can be determined only by understanding the context in which it will be used. Consider the data model (see the following figure) used in Chapter 4 to discuss the 1:m relationship. This fragment says a nation has many stocks. Is that really what we want to represent? Stocks are listed on a stock exchange, and a nation may have several stock exchanges. For example, the U.S. has the New York Stock Exchange and NASDAQ. Furthermore, some foreign stocks are listed on the New York Stock Exchange. If this is the world we have to describe, the data model is likely to differ from that shown in the figure. Try drawing the revised data model.
A 1:m relationship between STOCK and NATION
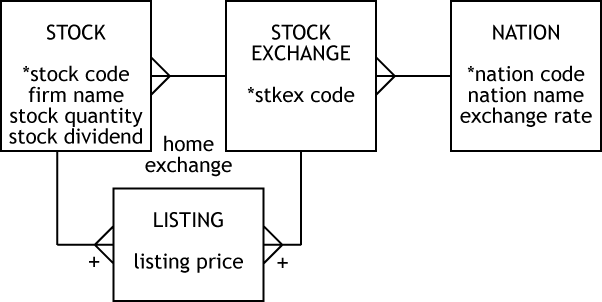
As you can see, the data model in the following figure is quite different from the initial data model of the preceding figure. Which one is better? They both can be valid models; it just depends on the world you are trying to represent and possible future queries. In the first case, the purpose was to determine the value of a portfolio. There was no interest in on which exchange stocks were listed or their home exchange. So the first model has high fidelity for the described situation.
The second data model would be appropriate if the client needed to know the home exchange of stocks and their price on the various exchanges where they are listed. The second data model is an improvement on the first if it incorporates the additional facts and relationships required. If it does not, then the additional detail is not worth the extra cost.
Revised NATION-STOCK data
A lesson in pure geography
A data model must be an accurate representation of the world you want to model. The data model must account for all the exceptions—there should be no impurities. Let’s say you want to establish a database to store details of the world’s cities. You might start with the data model depicted in the following figure.
A world’s cities data model
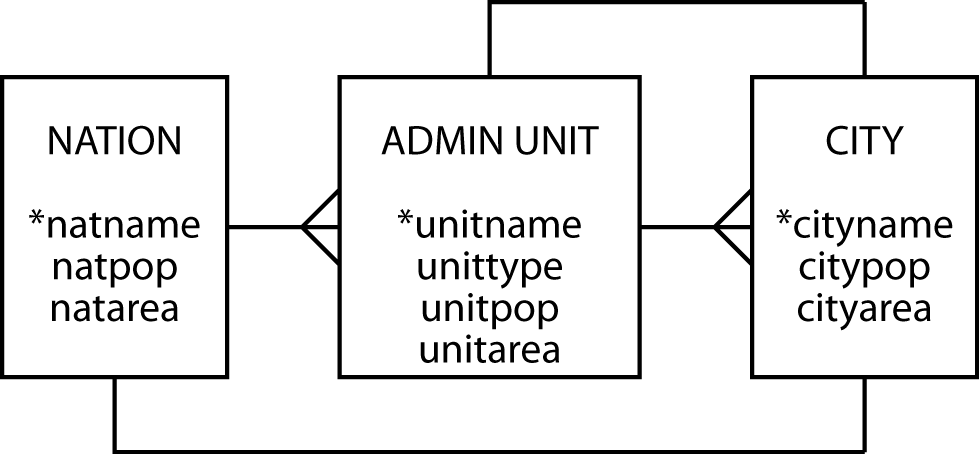
Before looking more closely at the data model, let’s clarify the meaning of unittype. Because most countries are divided into administrative units that are variously called states, provinces, territories, and so forth, unittype indicates the type of administrative unit (e.g., state).
How many errors can you find in the initial data model?
Problems and solutions for the initial world’s cities data model
| Problem | Solution | |
|---|---|---|
| 1 | City names are not unique. There is an Athens in Greece, and the U.S. has an Athens in Georgia, Alabama, Ohio, Pennsylvania, Tennessee, and Texas. | To identify a city uniquely, you need to specify its administrative unit and country. Add a plus sign to the crow’s feet between CITY and ADMIN UNIT and between ADMIN UNIT and NATION. |
| 2 | Administrative unit names are not necessarily unique. There used to be a Georgia in the old U.S.S.R., and there is a Georgia in the U.S. There is no guarantee that administrative unit names will always be unique. | To identify an administrative unit uniquely, you also need to know the country in which it is found. Add a plus sign to the crow’s foot between ADMIN UNIT and NATION. |
| 3 | There is an unlabeled 1:1 relationship between CITY and ADMIN UNIT and CITY and NATION. What do these mean? They are supposed to indicate that an administrative unit has a capital, and a nation has a capital. | Label relationships (e.g., national capital city). |
| 4 | The assumption is that a nation has only one capital, but there are exceptions. South Africa has three capitals: Cape Town (legislative), Pretoria (administrative), and Bloemfontein (judicial). You need only one exception to lower the fidelity of a data model significantly. | Change the relationship between NATION and CITY to 1:m. Add an attribute natcaptype to CITY to distinguish between types of capitals. |
| 5 | The assumption is that an administrative unit has only one capital, but there are exceptions. At one point, Chandigarh was the capital of two Indian states, Punjab and Haryana. The Indian state of Jammu & Kashmir has two capitals: Jammu (summer) and Srinagar (winter). | Change the relationship between ADMIN UNIT and CITY to m:m by creating an associative entity and include a distinguishing attribute of unitcaptype. |
| 6 | Some values can be derived. National population, natpop, and area, natarea, are the sum of the regional populations, regpop, and areas, regarea, respectively. The same rule does not apply to regions and cities because not everyone lives in a city. | Remove the attributes natpop and natarea from NATION. |
A revised world’s cities data model
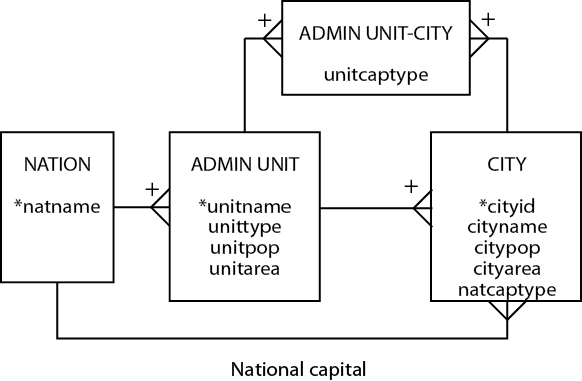
This geography lesson demonstrates how you often start with a simple model of low fidelity. By additional thinking about relationships and consideration of exceptions, you gradually create a high-fidelity data model.
❓ Skill builder
Write SQL to determine which administrative units have two capitals and which have a shared capital.
Family matters
Families can be very complicated. It can be tricky to keep track of all those relations—maybe you need a relational database (this is the worst joke in the book; they improve after this). We start with a very limited view of marriage and gradually ease the restrictions to demonstrate how any and all aspects of a relationship can be modeled. An initial fragment of the data model is shown in the following figure. There are several things to notice about it.
A man-woman data model
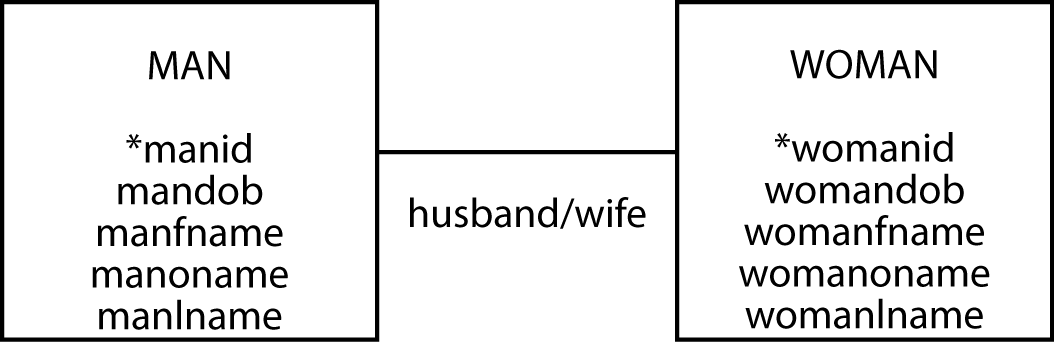
There is a 1:1 relationship between man and woman. The labels indicate that this relationship is marriage, but there is no indication of the marriage date. We are left to infer that the data model records the current marriage.
MAN and WOMAN have the same attributes. A prefix is used to make them unique. Both have an identifier (id), date of birth (dob), first name (fname), other names (oname), and last name (name).
Other names (oname) looks like a multivalued attribute, which is not allowed. Should oname be single or multivalue? This is a tricky decision. It depends on how these data will be used. If queries such as “find all men whose other names include Herbert” are likely, then a person’s other names—kept as a separate entity that has a 1:m relationship for MAN and WOMAN—must be established. That is, a man or woman can have one or more other names. However, if you just want to store the data for completeness and retrieve it in its entirety, then oname is fine. It is just a text string. The key question to ask is, “What is the lowest level of detail possibly required for future queries?” Also, remember that SQL’s REGEXP clause can be used to search for values within a text string.
The use of a prefix to distinguish attribute names in different entities suggests you should consider combining the entities. In this case, we could combine the entities MAN and WOMAN to create an entity called PERSON. Usually when entities are combined, you have to create a new attribute to distinguish between the different types. In this example, the attribute gender is added. We can also generalize the relationship label to spouse. The revised data model appears in the following figure.
A PERSON data model
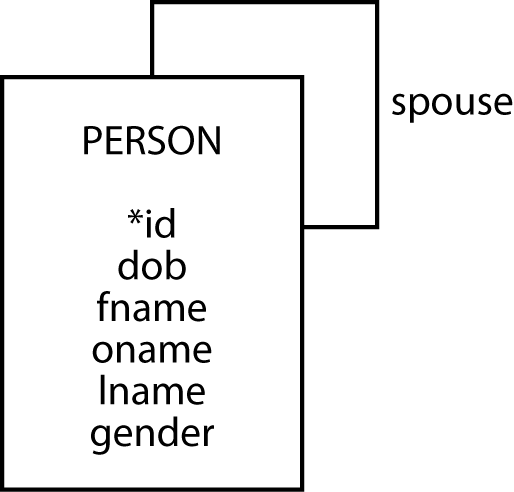
Now for a bit of marriage counseling. Marriage normally is a relationship between two people. Is that so? Well, some societies permit polygyny (one man can have many wives), others allow polyandry (one woman can have many husbands), and some permit same-sex marriages. So marriage, if we consider all the possibilities, is an m:m relationship between people, and partner might be a better choice than spouse for labeling the relationship Also, a person can be married more than once. To distinguish between different marriages, we really need to record the start and end date of each relationship and who was involved.
A marriage data model
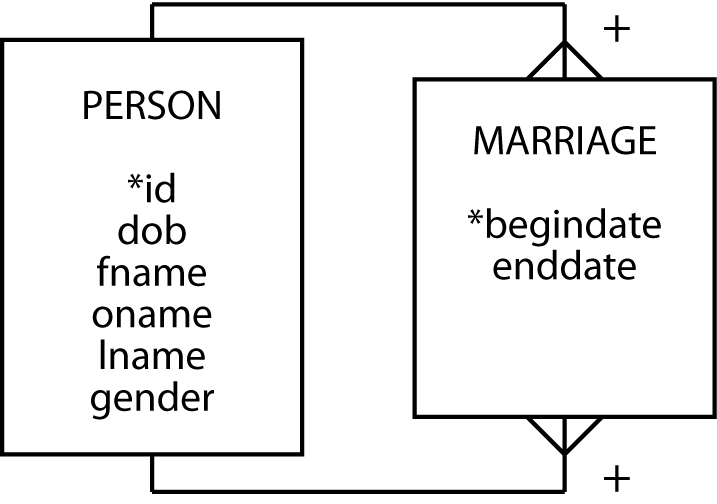
Marriage is an m:m relationship between two persons. It has attributes begindate and enddate. An instance of marriage is uniquely identified by a composite identifier: the two spouse identifiers and begindate. This means any marriage is uniquely identified by the composite of two person identifiers and the beginning date of the marriage. We need begindate as part of the identifier because the same couple might have more than one marriage (e.g., get divorced and remarry each other later). Furthermore, we can safely assume that it is impossible for a couple to get married, divorced, and remarried all on the one day. Begindate and enddate can be used to determine the current state of a marriage. If enddate is null, the marriage is current; otherwise, the couple has divorced.
This data model assumes a couple goes through some formal process to get married or divorced, and there is an official date for both of these events. What happens if they just gradually drift into cohabitation, and there is no official beginning date? Think about it. (The data model problem, that is—not cohabitation!) Many countries recognize this situation as a common-law marriage, so the data model needs to recognize it. The present data model cannot handle this situation because begindate cannot be null—it is an identifier. Instead, a new identifier is needed, and begindate should become an attribute.
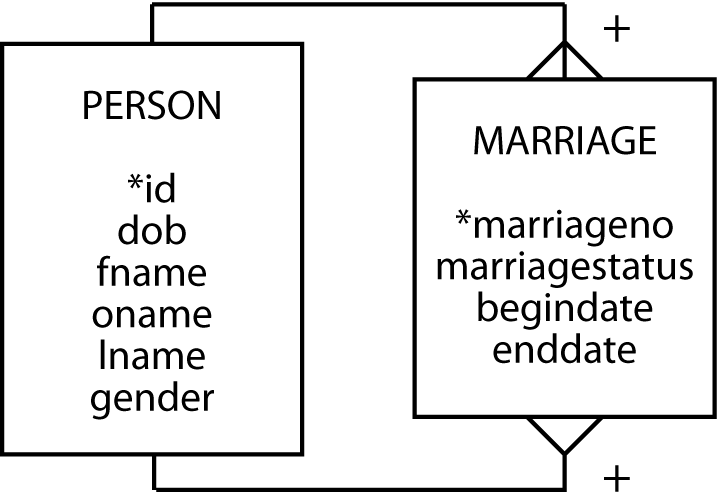
Two new attributes can handle a common-law marriage. Marriageno can count the number of times a couple has been married to each other. In the majority of cases, marriageno will be 1. Marriagestatus can record whether a marriage is current or ended. Now we have a data model that can also handle common-law marriages. This is also a high-quality data model in that the client does not have to remember to examine enddate to determine a marriage’s current status. It is easier to remember to examine marriagestatus to check status. Also, we can allow a couple to be married, divorced, and remarried as many times as they like on the one day—which means we can now use the database in Las Vegas.
A revised marriage data model
All right, now that we have the couple successfully married, we need to start thinking about children. A marriage has zero or more children, and let’s start with the assumption a child belongs to only one marriage. Therefore, we have a 1:m relationship between marriage and person to represent the children of a marriage.
A marriage with children data model
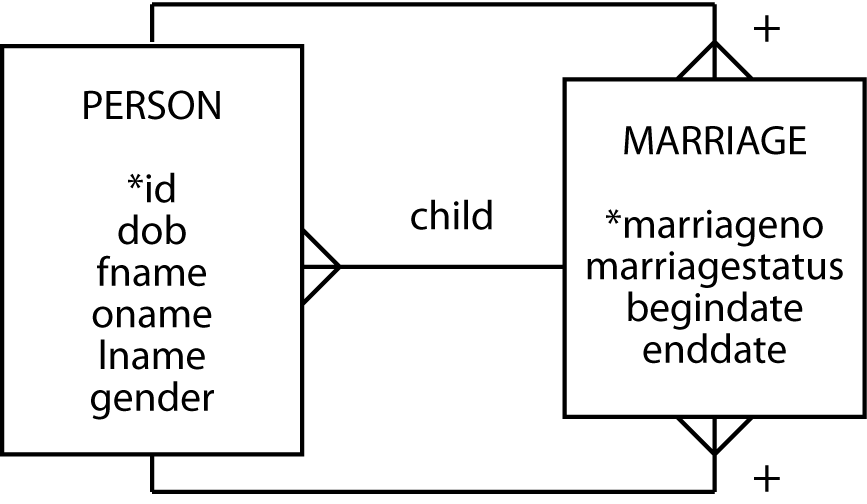
You might want to consider how the model would change to handle single-parent families, adopted children, and other aspects of human relationships.
❓ Skill builder
The International Commission for Border Resolution Disputes requires a database to record details of which countries have common borders. Design the database. Incidentally, which country borders the most other countries?
When’s a book not a book?
Sometimes we have to rethink our ideas of physical objects. Consider a data model for a library.
A library data model fragment

The preceding fragment assumes that a person borrows a book. What happens if the library has two copies of the book? Do we add an attribute to BOOK called copy number? No, because we would introduce redundancy by repeating the same information for each book. What you need to recognize is that in the realm of data modeling, a book is not really a physical thing, but the copy is, because it is what you borrow.
A revised library data model fragment

As you can see, a book has many copies, and a copy is of one book. A book can be identified by callno, which is usually a Library of Congress number or Dewey number. A copy is identified by a bookno. This is a unique number allocated by the library to the copy of the book. If you look in a library book, you will generally find it pasted on the inside back cover and shown in numeric or bar code format. Notice that it is called book number despite the fact that it really identifies a copy of a book. This is because most people, including librarians, think of the copy as a book.
The International Standard Book Number (ISBN) uniquely identifies any instance of a book (not copy). Although it sounds like a potential identifier for BOOK, it is not. ISBNs were introduced in the second half of the twentieth century, and books published before then do not have an ISBN.
A history lesson
Many organizations maintain historical data (e.g., a person’s job history or a student’s enrollment record). A data model can depict historical data relationships just as readily as current data relationships.
Consider the case of an employee who works for a firm that consists of divisions (e.g., production) and departments (e.g., quality control). The firm contains many departments, but a department belongs to only one division. At any one time, an employee belongs to only one department.
Employment history—take 1

The fragment in the figure can be amended to keep track of the divisions and departments in which a person works. While employed with a firm, a person can work in more than one department. Since a department can have many employees, we have an m:m relationship between DEPARTMENT and EMPLOYEE. We might call the resulting associative entity POSITION.
Employment history—take 2

The revised fragment records employee work history. Note that any instance of POSITION is identified by begdate and the identifiers for EMPLOYEE and DEPARTMENT. The fragment is typical of what happens when you move from just keeping current data to recording history. A 1:m becomes an m:m relationship to record history.
People who work get paid. How do we keep track of an employee’s pay data? An employee has many pay slips, but a pay slip belongs to one employee. When you look at a pay slip, you will find it contains many items: gross pay and a series of deductions for tax, medical insurance, and so on. Think of a pay slip as containing many lines, analogous to a sales form. Now look at the revised data model.
Employment history—take 3
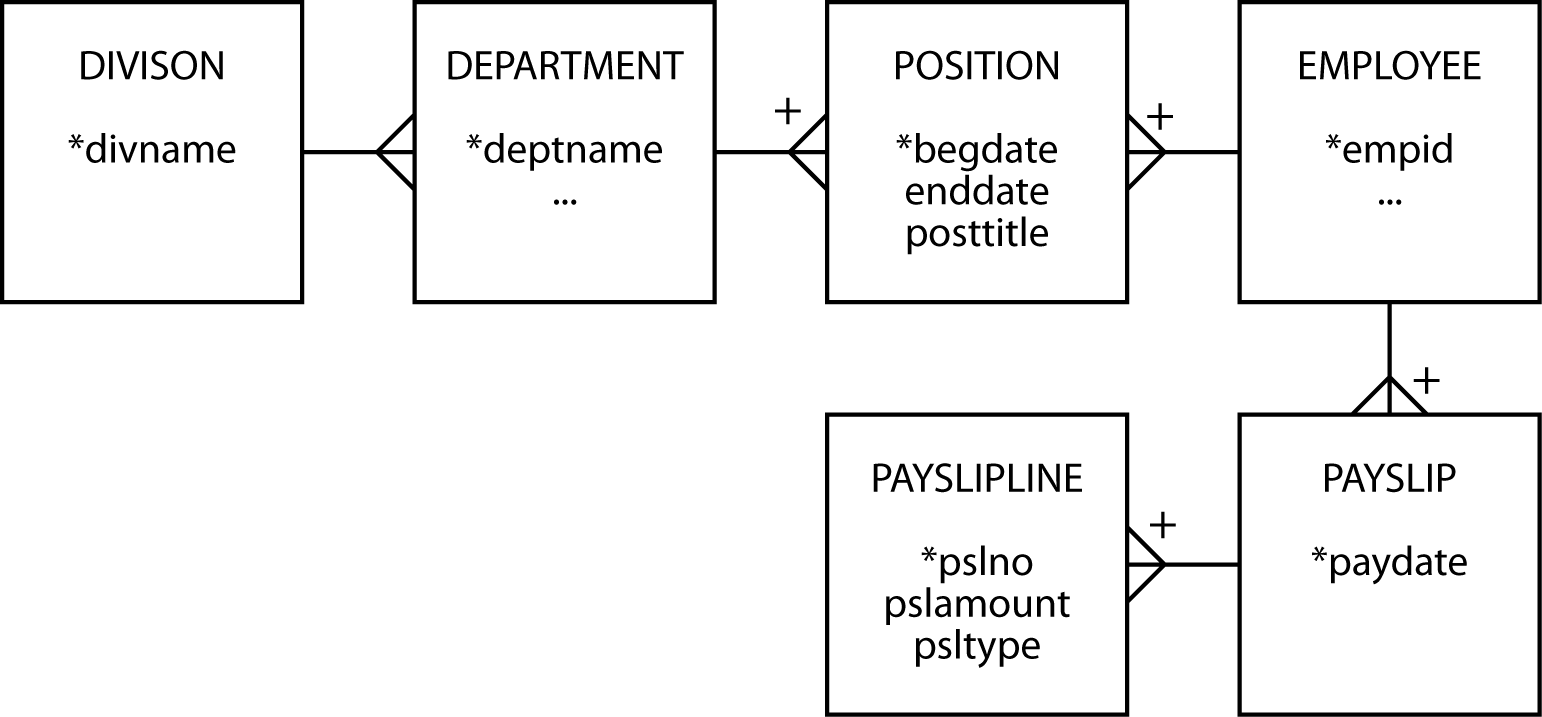
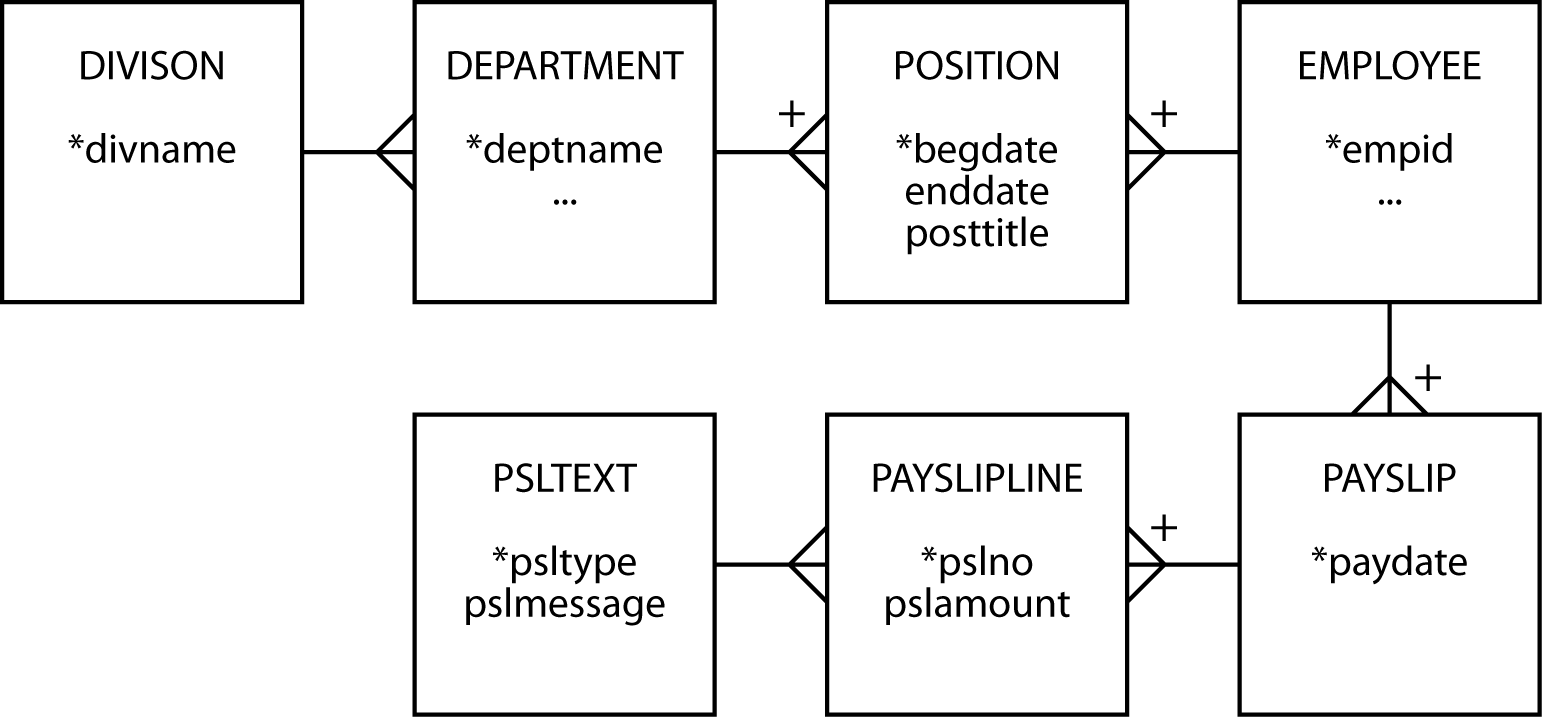
Typically, an amount shown on a pay slip is identified by a short text field (e.g., gross pay). PAYSLIPLINE contains an attribute psltype to identify the text that should accompany an amount, but where is the text? When dealing with codes like psltype and their associated text, the fidelity of a data model is improved by creating a separate entity, PSLTEXT, for the code and its text.
Employment history—take 4
A ménage à trois for entities
Consider aircraft leasing. A plane is leased to an airline for a specific period. When a lease expires, the plane can be leased to another airline. So, an aircraft can be leased many times, and an airline can lease many aircraft. Furthermore, there is an agent responsible for handling each deal. An agent can lease many aircraft and deal with many airlines. Over time, an airline will deal with many agents. When an agent reaches a deal with an airline to lease a particular aircraft, you have a transaction. If you analyze the aircraft leasing business, you discover there are three m:m relationships. You might think of these as three separate relationships.
An aircraft-airline-agent data model
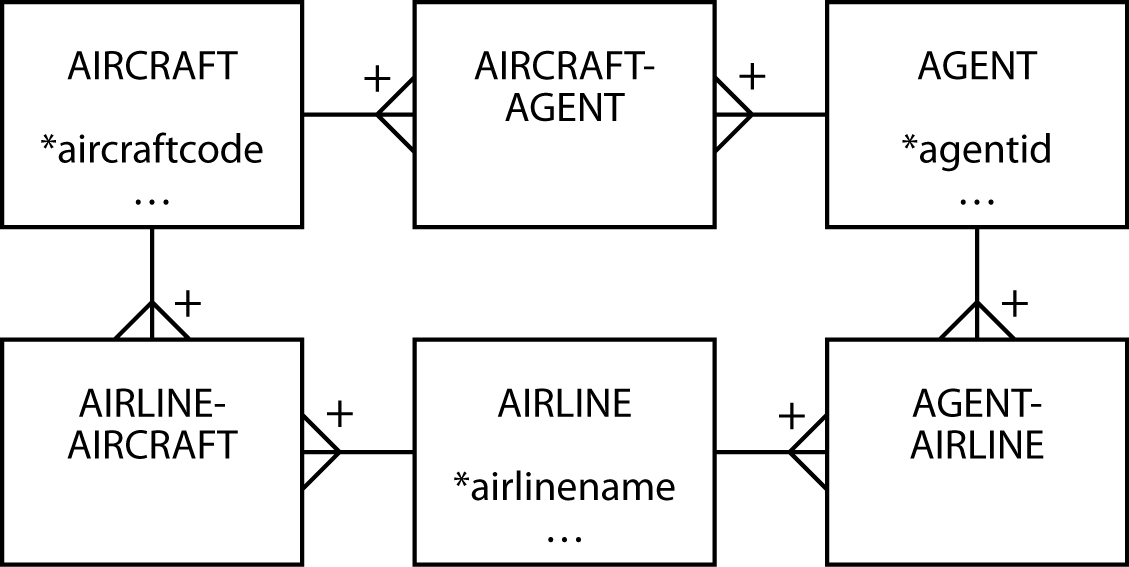
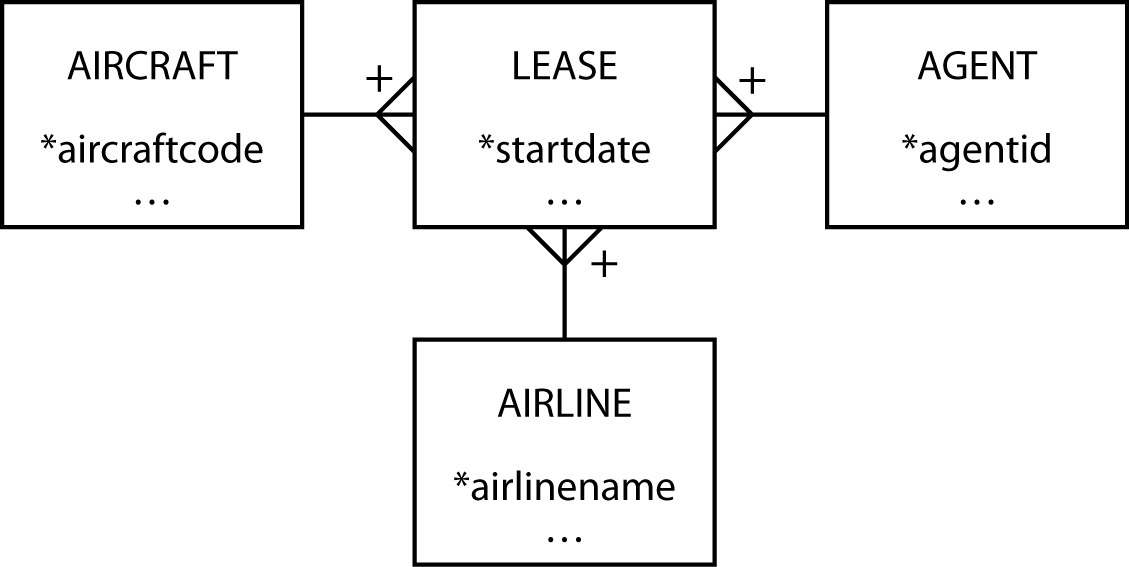
The problem with three separate m:m relationships is that it is unclear where to store data about the lease. Is it stored in AIRLINE-AIRCRAFT? If you store the information there, what do you do about recording the agent who closed the deal? After you read the fine print and do some more thinking, you discover that a lease is the association of these three entities in an m:m relationship.
A revised aircraft-airline-agent data model
❓ Skill builder
Horse racing is a popular sport in some parts of the world. A horse competes in at most one race on a course at a particular date. Over time, a horse can compete in many races on many courses. A horse’s rider is called a jockey, and a jockey can ride many horses and a horse can have many jockeys. Of course, there is only ever one jockey riding a horse at a particular time. Courses vary in their features, such as the length of the course and the type of surface (e.g., dirt or grass). Design a database to keep track of the results of horse races.
Project management—planning and doing
Project management involves both planned and actual data. A project is divided into a number of activities that use resources. Planning includes estimation of the resources to be consumed. When a project is being executed, managers keep track of the resources used to monitor progress and keep the project on budget. Planning data may not be as detailed as actual data and is typically fairly broad, such as an estimate of the number of hours that an activity will take. Actual data will be more detailed because they are usually collected by getting those assigned to the project to log a daily account of how they spent their time. Also, resources used on a project are allocated to a particular activity. For the purposes of this data model, we will focus on recording only time and nothing else.
A project management data model
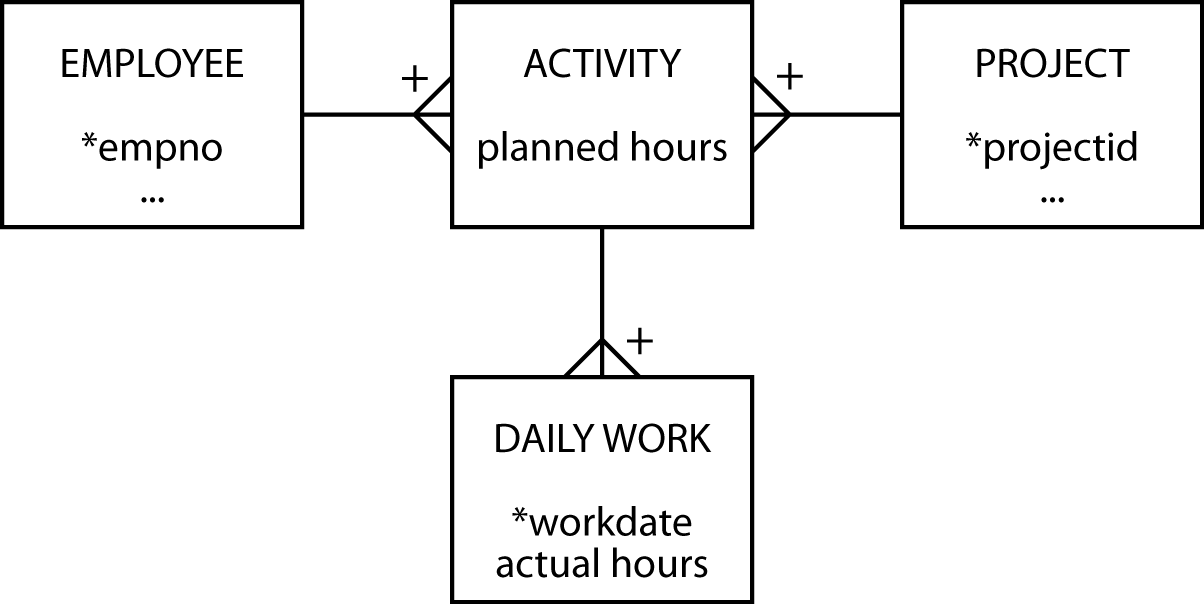
Notice that planned hours is an attribute of ACTIVITY, and actual hours is an attribute of DAILY WORK. The hours spent on an activity are derived by summing actual hours in the associated DAILY WORK entity. This is a high-fidelity data model if planning is done at the activity level and employees submit daily worksheets. Planning can be done in greater detail, however, if planners indicate how many hours of each day each employee should spend on a project.
A revised project management data model
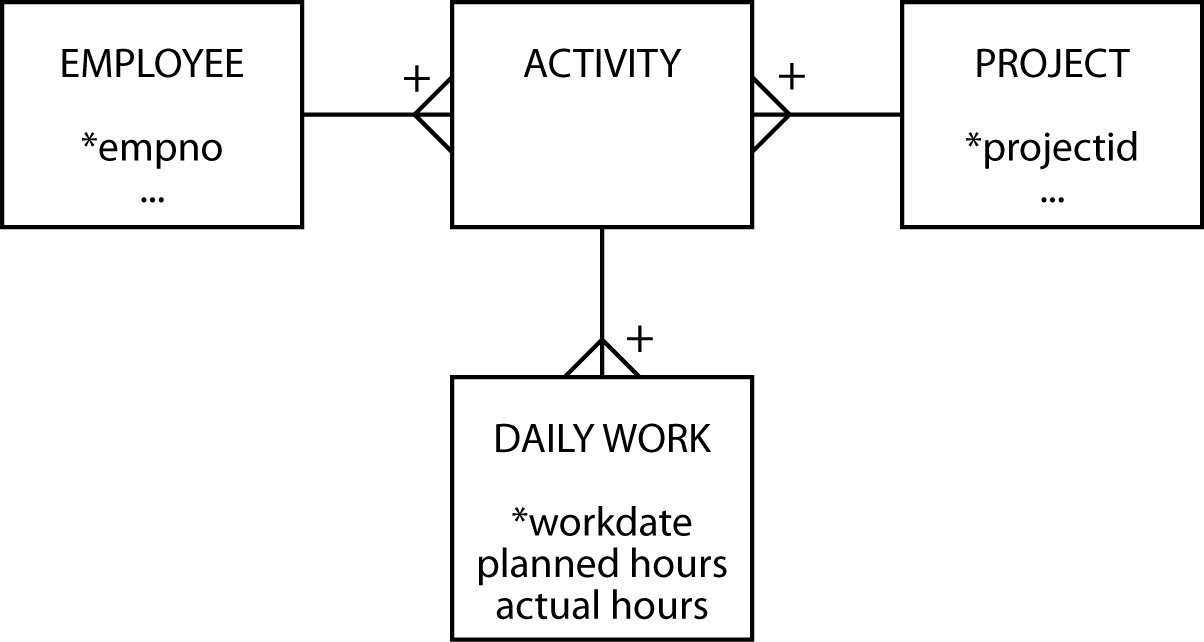
Now you see that planned hours and actual hours are both attributes of DAILY WORK. The message of this example, therefore, is not to assume that planned and actual data have the same level of detail, but do not be surprised if they do.
Cardinality
Some data modeling languages are quite precise in specifying the cardinality, or multiplicity, of a relationship. Thus, in a 1:m relationship, you might see additional information on the diagram. For example, the “many” end of the relationship might contain notation (such as 0,n) to indicate zero or more instances of the entity at the “many” end of the relationship.
Cardinality and modality options
| Cardinality | Modality | Meaning |
|---|---|---|
| 0,1 | Optional | There can be zero or one instance of the entity relative to the other entity. |
| 1,1 | Mandatory | There is exactly one instance of the entity relative to the other entity. |
| 1,n | The entity must have at least one and can have many instances relative to the other entity. |
The data modeling method of this text, as you now realize, has taken a broad approach to cardinality (is it 1:1 or 1:m?). We have not been concerned with greater precision (is it 0,1 or 1,1?), because the focus has been on acquiring basic data modeling skills. Once you know how to model, you can add more detail. When learning to model, too much detail and too much terminology can get in the way of mastering this difficult skill. Also, it is far easier to sketch models on a whiteboard or paper when you have less to draw. Once you switch to a data modeling tool, then adding cardinality precision is easier and appropriate.
Modality
Modality, also known as optionality, specifies whether an instance of an entity must participate in a relationship. Cardinality indicates the range of instances of an entity participating in a relationship, while modality defines the minimum number of instances. Cardinality and modality are linked, as shown in the previous table . If an entity is optional, the minimum cardinality will be 0, and if mandatory, the minimum cardinality is 1.
By asking the question, “Does an occurrence of this entity require an occurrence of the other entity?” you can assess whether an entity is mandatory. The usual practice is to use “O” for optional and place it near the entity that is optional. Mandatory relationships are often indicated by a short line (or bar) at right angles to the relationship between the entities.
In the following figure, it is mandatory for an instance of STOCK to have an instance of NATION, and optional for an instance of NATION to have an instance of STOCK, which means we can record details of a nation for which stocks have not yet been purchased. During conversion of the data model to a relational database, the mandatory requirement (i.e., each stock must have a nation) is enforced by the foreign key constraint.
1:m relationship showing modality

Now consider an example of an m:m relationship. A SALE can have many LINEITEMs, and a LINEITEM has only one SALE. An instance of LINEITEM must be related to an instance of SALE, otherwise it can’t exist. Similarly, it is mandatory for an instance of SALE to have an instance of LINEITEM, because it makes no sense to have a sale without any items being sold.
In a relational database, the foreign key constraint handles the mandatory relationship between instances of LINEITEM and SALE, The mandatory requirement between SALE and LINEITEM has to be built into the processing logic of the application that processes a sales transaction. Basic business logic requires that a sale include some items, so a sales transaction creates one instance of SALE and multiple instances of LINEITEM. It does not make sense to have a sale that does not sell something.
An m:m relationship showing modality

The relationship between ITEM and LINEITEM is similar in structure to that of NATION and STOCK, which we saw in the previous example. An instance of a LINEITEM has a mandatory requirement for an instance of ITEM. An instance of an ITEM can exist without the need for an instance of a LINEITEM (i.e., the items that have not been sold).
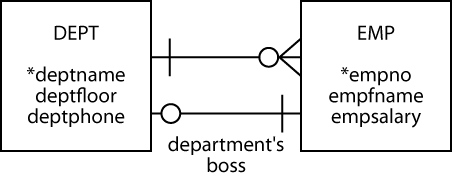
We gain further understanding of modality by considering a 1:1 relationship. We focus attention on the 1:1 because the 1:m relationship has been covered. The 1:1 implies that it is mandatory for an instance of DEPT to be related to one instance of EMP (i.e., a department must have a person who is the boss), and an instance of EMP is optionally related to one instance of DEPT (i.e., an employee can be a boss, but not all employees are departmental bosses).
A 1:1 relationship showing modality
Earlier, when deciding where to store the foreign key for the 1:1 relationship, we settled on placing the foreign key in DEPT, because all departments have a boss. Now we have a rule. The foreign key goes with the entity for which the relationship is mandatory. When specifying the create statements, you will need to be aware of the chicken-and-egg connection between DEPT and EMP. We cannot insert an employee in EMP unless we know that person’s department, and we cannot insert a department unless we have already inserted the boss for that department in EMP. We can get around this problem by using a deferrable foreign key constraint, but at this point we don’t know enough about transaction processing to discuss this approach.
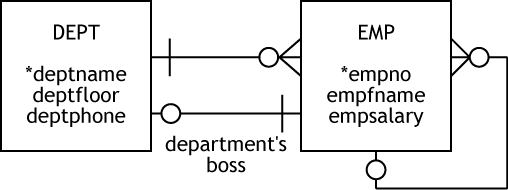
Let’s now consider recursive relationships. The following figure shows a recursive 1:m between employees, representing that one employee can be the boss of many other employees and a person has one boss. It is optional that a person is a boss, and optional that everyone has a boss, mainly because there has to be one person who is the boss of everyone. However, we can get around this one exception by inserting employees in a particular order. By inserting the biggest boss first, we effectively make it mandatory that all employees have a boss. Nevertheless, data models cover every situation and exception, so we still show the relationship as optional.
1:m recursive with modality
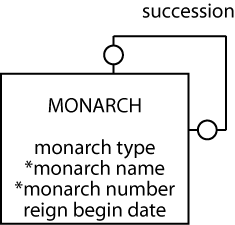
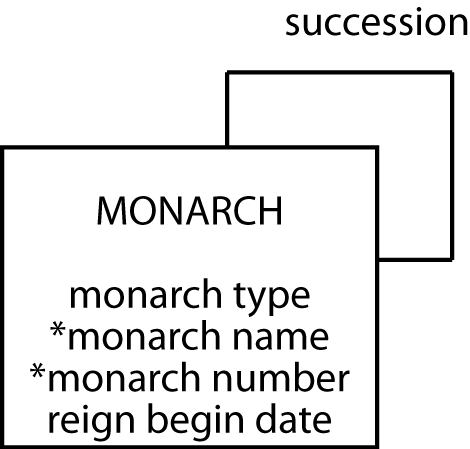
We rely again on the British monarchy. This time we use it to illustrate modality with a 1:1 recursive relationship. As the following figure shows, it is optional for a monarch to have a successor. We are not talking about the end of a monarchy, but rather how we address the data modeling issue of not knowing who succeeds the current monarch. Similarly, there must be a monarch who did not succeed someone (i.e., the first king or queen). Thus, both ends of the succession relationship have optional modality.
1:1 recursive with modality
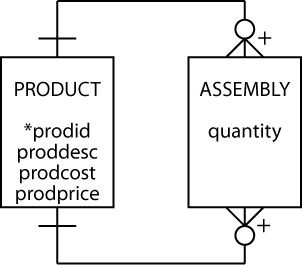
Finally, in our exploration of modality, we examine the m:m recursive. The model indicates that it is optional for a product to have components and optional for a product to be a component in other products. However, every assembly must have associated products.
m:m recursive with modality
Summary
Modality adds additional information to a data model, and once you have grasped the fundamental ideas of entities and relationships, it is quite straightforward to consider whether a relationship is optional or mandatory. When a relationship is mandatory, you need to consider what constraint you can add to a table’s definition to enforce the relationship. As we have seen, in some cases the foreign key constraint handles mandatory relationships. In other cases, the logic for enforcing a requirement will be built into the application.
Entity types
A data model contains different kinds of entities, which are distinguished by the format of their identifiers. Labeling each of these entities by type will help you to determine what questions to ask.
Independent entity
An independent entity is often central to a data model and foremost in the client’s mind. Independent entities are frequently the starting points of a data model. Remember that in the investment database, the independent entities are STOCK and NATION. Independent entities typically have clearly distinguishable names because they occur so frequently in the client’s world. In addition, they usually have a single identifier, such as stock code or nation code.
Independent entities are often connected to other independent entities in a 1:m or m:m relationship. The data model in the following figure shows two independent entities linked in a 1:m relationship.
NATION and STOCK—independent entities
Weak or dependent entity
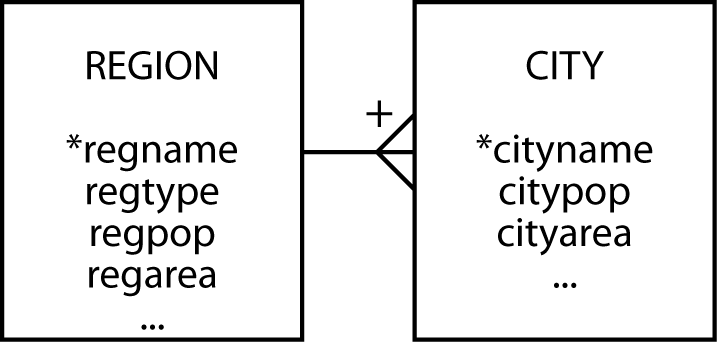
A weak entity (also known as a dependent entity) relies on another entity for its existence and identification. It is recognized by a plus on the weak entity’s end of the relationship. CITY cannot exist without REGION. A CITY is uniquely identified by cityname and regname. If the composite identifier becomes unwieldy, creating an arbitrary identifier (e.g., cityno) will change the weak entity into an independent one.
CITY—a weak entity
Associative entity
Associative entities are by-products of m:m relationships. They are typically found between independent entities. Associative entities sometimes have obvious names because they occur in the real world. For instance, the associative entity for the m:m relationship between DEPARTMENT and EMPLOYEE is usually called POSITION. If the associative entity does not have a common name, the two entity names are generally hyphenated (e.g., DEPARTMENT-EMPLOYEE). Always search for the appropriate name, because it will improve the quality of the data model. Hyphenated names are a last resort.
POSITION is an associative entity
Associative entities can show either the current or the historic relationship between two entities. If an associative entity’s only identifiers are the two related entities’ identifiers, then it records the current relationship between the entities. If the associative entity has some time measure (e.g., date or hour) as a partial identifier, then it records the history of the relationship. Whenever you find an associative entity, ask the client whether the history of the relationship should be recorded.
Creating a single, arbitrary identifier for an associative entity will change it to an independent one. This is likely to happen if the associative entity becomes central to an application. For example, if a personnel department does a lot of work with POSITION, it may find it more expedient to give it a separate identifier (e.g., position number).
Aggregate entity
An aggregate entity is created when several different entities have similar attributes that are distinguished by a preceding or following modifier to keep their names unique. For example, because components of an address might occur in several entities (e.g., CUSTOMER and SUPPLIER), an aggregate address entity can be created to store details of all addresses. Aggregate entities usually become independent entities. In this case, we could use address number to identify an instance of address uniquely.
Subordinate entity
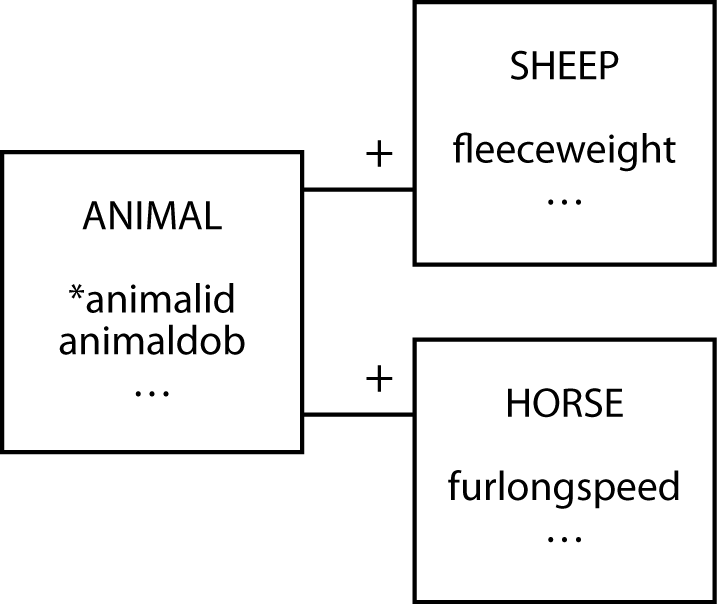
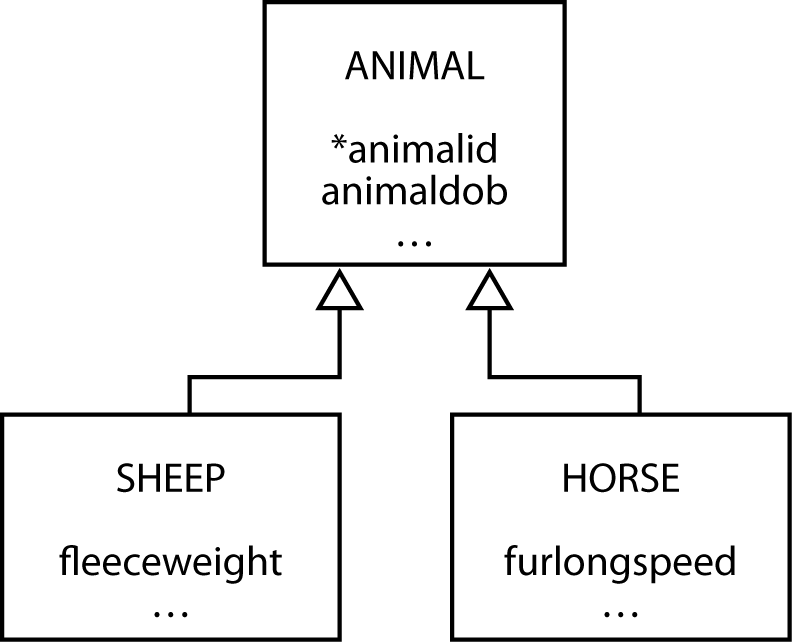
A subordinate entity stores data about an entity that can vary among instances. A subordinate entity is useful when an entity consists of mutually exclusive classes that have different descriptions. The farm animal database shown in the following figure indicates that the farmer requires different data for sheep and horses. Notice that each of the subordinate entities is identified by the related entity’s identifier. You could avoid subordinate entities by placing all the attributes in ANIMAL, but then you make it incumbent on the client to remember which attributes apply to horses and which to sheep. This becomes an important issue for null fields. For example, is the attribute hay consumption null because it does not apply to sheep, or is it null because the value is unknown?
SHEEP and HORSE are subordinate entities
If a subordinate entity becomes important, it is likely to evolve into an independent entity. The framing of a problem often determines whether subordinate entities are created. Stating the problem as, “a farmer has many animals, and these animals can be horses or sheep,” might lead to the creation of subordinate entities. Alternatively, saying that “a farmer has many sheep and horses” might lead to setting up SHEEP and HORSE as independent entities.
Generalization and aggregation
Generalization and aggregation are common ideas in many modeling languages, particularly object-oriented modeling languages such as the Unified Modeling Language (UML), which we will use in this section.
Generalization
A generalization is a relationship between a more general element and a more specific element. In the following figure, the general element is animal, and the specific elements are sheep and horse. A horse is a subtype of animal. A generalization is often called an “is a” relationship because the subtype element is a member of the generalization.
A generalization is directly mapped to the relational model with one table for each entity. For each of the subtype entities (i.e., SHEEP and HORSE), the primary key is that of the supertype entity (i.e., ANIMAL). You must also make this column a foreign key so that a subtype cannot be inserted without the presence of the matching supertype. A generalization is represented by a series of 1:1 relationships to weak entities.
A generalization hierarchy in UML
Aggregation
Aggregation is a part-whole relationship between two entities. Common phrases used to describe an aggregation are “consists of,” “contains,” and “is part of.” The following figure shows an aggregation where a herd consists of many cows. Cows can be removed or added, but it is still a herd. An open diamond next to the whole denotes an aggregation. In data modeling terms, there is a 1:m relationship between herd and cow.
An aggregation in UML and data modeling

There are two special types of aggregation: shared and composition. With shared aggregation, one entity owns another entity, but other entities can own that entity as well. A sample shared aggregation is displayed in the following figure, which shows that a class has many students, and a student can be a member of many classes. Students, the parts in this case, can be part of many classes. An open diamond next to the whole denotes a shared aggregation, which we represent in data modeling as an m:m relationship.
Shared aggregation in UML and data modeling

In a composition aggregation, one entity exclusively owns the other entity. A solid diamond at the whole end of the relationship denotes composition aggregation. The appropriate data model is a weak entity, as shown in the following figure.
Composition aggregation in UML and data modeling

Data modeling hints
A high-fidelity data model takes time to develop. The client must explain the problem fully so that the database designer can understand the client’s requirements and translate them into a data model. Data modeling is like prototyping; the database designer gradually creates a model of the database as a result of interaction with the client. Some issues will frequently arise in this progressive creation, and the following hints should help you resolve many of the common problems you will encounter.
The rise and fall of a data model
Expect your data model to both expand and contract. Your initial data model will expand as you extend the boundaries of the application. You will discover some attributes will evolve into entities, and some 1:m relationships will become m:m relationships. It will grow because you will add entities, attributes, and relationships to allow for exceptions. Your data model will grow because you are representing the complexity of the real world. Do not try to constrain growth. Let the data model be as large as is necessary. As a rough rule, expect your final data model to grow to about two to three times the number of entities of your initial data model.
Expect your data model to contract as you generalize structures. The following fragment is typical of the models produced by novice data modelers. It can be reduced by recognizing that PAINTING, SCULPTURE, and CERAMIC are all types of art. A more general entity, ART, could be used to represent the same data. Of course, it would need an additional attribute to distinguish the different types of art recordings.
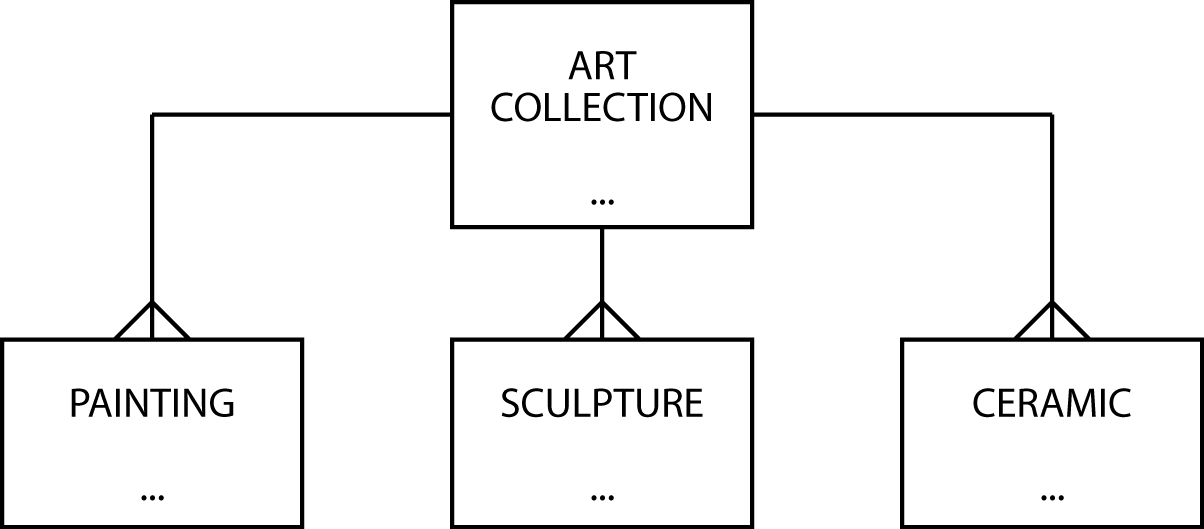
The shrunken data model

As you discover new entities, your data model will grow. As you generalize, your data model will shrink.
Identifier
If there is no obvious simple identifier, invent one. The simplest is a meaningless code (e.g., person number or order number). If you create an identifier, you can also guarantee its uniqueness.
Don’t overwork an identifier. The worst case we have seen is a 22-character product code used by a plastics company that supposedly not only uniquely identified an item but told you its color, its manufacturing process, and type of plastic used to make it! Color, manufacturing process, and type of plastic are all attributes. This product code was unwieldy. Data entry error rates were extremely high, and very few people could remember how to decipher the code.
An identifier has to do only one thing: uniquely identify every instance of the entity. Sometimes trying to make it do double, or even triple, duty only creates more work for the client.
Position and order
There is no ordering in a data model. Entities can appear anywhere. You will usually find a central entity near the middle of the data model only because you tend to start with prominent entities (e.g., starting with STUDENT when modeling a student information system). What really matters is that you identify all relevant entities.
Attributes are in no order. You find that you will tend to list them as they are identified. For readability, it is a good idea to list some attributes sequentially. For example, first name, other names, and last name are usually together. This is not necessary, but it speeds up verification of a data model’s completeness.
Instances are also assumed to have no ordering. There is no first instance, next instance, or last instance. If you must recognize a particular order, create an attribute to record the order. For example, if ranking of potential investment projects must be recorded, include an attribute (projrank) to store this data. This does not mean the instances will be stored in projrank order, but it does allow you to use the ORDER BY clause of SQL to report the projects in rank order.
If you need to store details of a precedence relationship (i.e., there is an ordering of instances and a need to know the successor and predecessor of any instance), then use a 1:1 recursive relationship.
Using an attribute to record an ordering of instances
Attributes and consistency
Attributes must be consistent, retaining the same meaning for every instance. An example of an inconsistent attribute would be an attribute stock info that contains a stock’s PE ratio or its ROI (return on investment). Another attribute, say stock info code, is required to decipher which meaning applies to any particular instance. The code could be “1” for PE and “2” for ROI. If one attribute determines the meaning of another, you have inconsistency. Writing SQL queries will be extremely challenging because inconsistent data increases query complexity. It is better to create separate attributes for PE and ROI.
Names and addresses
An attribute is the smallest piece of data that will conceivably form part of a query. If an attribute has segments (e.g., a person’s name), determine whether these could form part of a query. If so, then make them separate attributes and reapply the query test. When you apply the query test to person name, you will usually decide to create three attributes: first name, other names, and last name.
What about titles? There are two sorts of modifier titles: preceding titles (e.g., Mr., Mrs., Ms., and Dr.) and following titles (e.g., Jr. and III). These should be separate attributes, especially if you have divided name into separate attributes.
Addresses seem to cause more concern than names because they are more variant. Business addresses tend to be the most complicated, and foreign addresses add a few more twists. The data model fragment in the following figure works in most cases.
Handling addresses

Common features of every address are city, state (province in Canada, county in Ireland), postal code (ZIP code in the United States), and nation. Some of these can be null. For example, Singapore does not have any units corresponding to states. In the United States, city and state can be derived from the zip code, but this is not necessarily true for other countries. Furthermore, even if this were true for every nation, you would need a different derivation rule for each country, which is a complexity you might want to avoid. If there is a lifetime guarantee that every address in the database will be for one country, then examine the possibility of reducing redundancy by just storing post code.
Notice that the problem of multiple address lines is represented by a 1:m relationship. An address line is a text string that appears as one line of an address. There is often a set sequence in which these are displayed. The attribute address rank records this order.
How do you address students? First names may be all right for class, but it is not adequate enough for student records. Students typically have multiple addresses: a home address, a school address, and maybe a summer address. The following data model fragment shows how to handle this situation. Any instance of ADDRESS LINE is identified by the composite of *studentid**, addresstype, and address rank.
Students with multiple addresses

The identifier address type is used to distinguish among the different types of addresses. The same data model fragment works in situations where a business has different mailing and shipping addresses.
When data modeling, can you take a shortcut with names and addresses? It is time consuming to write out all the components of name and address. It creates clutter and does not add much fidelity. Our practical advice is to do two things. First, create a policy for all names and addresses (e.g., all names will be stored as three parts: first name, other names, last name). Second, use shorthand forms of attributes for names and addresses when they obey the policy. So from now on, we will sometimes use name and address as attributes with the understanding that when the database is created, the parts will become separate columns.
Single-instance entities
Do not be afraid of creating an entity with a single instance. Consider the data model fragment in the following figure which describes a single fast-food chain. Because the data model describes only one firm, the entity FIRM will have only one instance. The inclusion of this single instance entity permits facts about the firm to be maintained. Furthermore, it provides flexibility for expansion. If two fast-food chains combine, the data model needs no amendment.
FIRM—a single-instance entity
.png)
Picking words
Words are very important. They are all we have to make ourselves understood. Let the client choose the words, because the data model belongs to the client and describes the client’s world. If you try to impose your words on the client, you are likely to create a misunderstanding.
Synonyms
Synonyms are words that have the same meaning. For example, task, assignment, and project might all refer to the same real-world object. One of these terms, maybe the one in most common use, needs to be selected for naming the entity. Clients need to be told the official name for the entity and encouraged to adopt this term for describing it. Alternatively, create views that enable clients to use their own term. Synonyms are not a technical problem. It is a social problem of getting clients to agree on one word.
Homonyms
Homonyms are words that sound the same but have different meanings. Homonyms can create real confusion. Sale date is a classic example. In business it can have several meanings. To the salespeople, it might be the day that the customer shakes hands and says, “We have a deal.” For the lawyers, it is could be the day when the contract is signed, and for production, it might be the day the customer takes delivery. In this case, the solution is reasonably obvious; redefine sale date to be separate terms for each area (e.g., sales date, contract date, and delivery date for sales, legal, and production departments, respectively).
Homonyms cause real confusion when clients do not realize that they are using the same word for different entities or attributes. Hunt down homonyms by asking lots of questions and querying a range of clients.
Exception hunting
Go hunting for exceptions. Keep asking the client questions such as
Is it always like this?
Would there be any situations where this could be an m:m relationship?
Have there ever been any exceptions?
Are things likely to change in the future?
Always probe for exceptions and look for them in the examples the client uses. Redesigning the data model to handle exceptions increases fidelity.
Relationship labeling
Relationship labeling clutters a data model. In most cases, labels can be correctly inferred, so use labels only when there is a possibility of ambiguity.
Keeping the data model in shape
As you add to a data model, maintain fidelity. Do not add entities without also completing details of the identifier and attributes. By keeping the data model well formed, you avoid ambiguity, which frequently leads to miscommunication.
Used entities
Would you buy a used data model? Certainly, because a used data model is more likely to have higher fidelity than a brand new one. A used data model has been subjected to much scrutiny and revision and should be a more accurate representation of the real world.
Meaningful identifiers
An identifier is said to be meaningful when some attributes of the entity can be inferred from the identifier’s value (e.g., a code of B78 for an item informs a clerk that the item is black). The word “meaningful” in everyday speech usually connotes something desirable, but many data managers agree that meaningful identifiers or codes create problems. While avoiding meaningful identifiers is generally accepted as good data management practice, they are still widely used. After a short description of some examples of meaningful identifiers, this section discusses the pros and cons of meaningful identifiers.
The invoice number “12dec0001” is a meaningful identifier. The first five positions indicate in which period the invoice was generated. The last four digits of the invoice number have a meaning. The 0001 indicates it was the first invoice sent in December. In addition, e-mail addresses, like mvdpas@bizzo.yx, have a meaning.
When coding a person’s employment status, a designer might use the codes “f” and “p” for full- and part-time and another might use “1” and “2.” The pair (f, p) is meaningful, but (1, 2) is not and puts the onus on the client to remember the meaning. The codes “f” and “p” are derived from the reality that they represent. They are the first letters of the words full and part. The “1” and “2” are not abstracted from reality, and therefore they do not have an intuitive meaning.
In determining whether an identifier is meaningful, one can look at the way new values of that identifier are generated. If the creation takes place on the basis of characteristics that appear in reality, the identifier is meaningful. That is why the identifier of the invoice “12dec0002,” which is the identifier assigned to the second invoice generated in December 2012, is meaningful. It is also why the e-mail address rwatson@terry.uga.edu is meaningful
Meaningful identifiers clearly have some advantages and disadvantages, and these are now considered.
Advantages and disadvantages of meaningful identifiers
| Advantages | Disadvantages |
|---|---|
| Recognizable and rememberable | Identifier exhaustion |
| Administrative simplicity | Reality changes |
| Loss of meaningfulness |
Advantages of meaningful identifiers
Recognizable and rememberable
People can often recognize and remember the significance of meaningful identifiers. If, for example, someone receives an e-mail from rwatson@terry.uga.edu, this person can probably deduce the sender’s name and workplace. If a manufacturer, for instance, uses the last two digits of its furniture code to indicate the color (e.g., 08 = beech), employees can then quickly determine the color of a packed piece of furniture. Of course, the firm could also show the color of the furniture on the label, in which case customers, who are most unlikely to know the coding scheme, can quickly determine the color of the enclosed product.
Administrative simplicity
By using meaningful identifiers, administration can be relatively easily decentralized. Administering e-mail addresses, for instance, can be handled at the domain level. This way, one can avoid the process of synchronizing with other domains whenever a new e-mail address is created.
A second example is the EAN (European article number), the bar code on European products. Issuing EANs can be administered per country, since each country has a unique number in the EAN. When issuing a new number, a country need only issue a code that is not yet in use in that country. The method of contacting all countries to ask whether an EAN has already been issued is time consuming and open to error. On the other hand, creating a central database of issued EAN codes is an option. If every issuer of EAN codes can access such a database, alignment among countries is created and duplicates are prevented.
Disadvantages of meaningful identifiers
Identifier exhaustion
Suppose a company with a six-digit item identifier decides to use the first three digits to specify the product group (e.g., stationery) uniquely. Within this group, the remaining three digits are used to define the item (e.g., yellow lined pad). As a consequence, only one thousand items can be specified per product group. This problem remains even when some numbers in a specific product group, or even when entire product groups, are not used.
Consider the case when product group “010” is exhausted and is supplemented by the still unused product group code “940.” What seems to be a simple quick fix causes problems, because a particular product group is not uniquely identified by a single identifier. Clients have to remember there is an exception.
A real-world example of identifier exhaustion is a holding company that identifies its subsidiaries by using a code, where the first character is the first letter of the subsidiary’s name. When the holding company acquired its seventh subsidiary, the meaningfulness of the coding system failed. The newly acquired subsidiary name started with the same letter as one of the existing subsidiaries. The system had already run out of identifiers.
When existing identifiers have to be converted because of exhaustion, printed codes on labels, packages, shelves, and catalogs will have to be redone. Recoding is an expensive process and should be avoided.
Exhaustion is not only a problem with meaningful identifiers. It can happen with non-meaningful identifiers. The problem is that meaningful identifier systems tend to exhaust sooner. To avoid identifier exhaustion and maintain meaningful identifiers, some designers increase identifier lengths (e.g., four digits for product group).
Reality changes
The second problem of meaningful identifiers is that the reality they record changes. For example, a company changes its name. The College of Business at the University of Georgia was renamed the Terry College of Business. Email addresses changed (e.g., rwatson@cba.uga.edu became rwatson@terry.uga.edu). An identifier can remain meaningful over a long period only if the meaningful part rarely or never changes.
Non-meaningful identifiers avoid reality changes. Consider the case of most telephone billing systems, which use an account ID to identify a customer rather than a telephone number. This means a customer can change telephone numbers without causing any coding problems because telephone number is not the unique identifier of each customer.
A meaningful identifier can lose its meaningfulness
Consider the problems that can occur with the identifier that records both the color and the material of an article. Chipboard with a beech wood veneer is coded BW. A black product, on the other hand, is coded BL. Problems arise whenever there is an overlap between these characteristics. What happens with a product that is finished with a black veneer on beech wood? Should the code be BW or BL? What about a black-painted product that is made out of beech wood? Maybe a new code, BB for black beech wood, is required. There will always be employees and customers who do not know the meaning of these not-so-meaningful identifiers and attribute the wrong meaning to them.
The solution—non-meaningful identifiers
Most people are initially inclined to try to make identifiers meaningful. There is a sense that something is lost by using a simple numeric to identify a product or customer. Nothing, however, is lost and much is gained. Non-meaningful identifiers serve their sole purpose well—to identify an entity uniquely. Attributes are used to describe the characteristics of the entity (e.g., color, type of wood). A clear distinction between the role of identifiers and attributes creates fewer data management problems now and in the future.
Vehicle identification In most countries, every road vehicle is uniquely identified. The Vehicle Identification Number (VIN) was originally described in ISO Standard 3779 in February 1977 and last revised in 1983. It is designed to identify motor vehicles, trailers, motorcycles, and mopeds. A VIN is 17 characters, A through Z and 0 through 9. The European Union and the United States have different implementations of the standard. The U.S. VIN is divided into four parts
When decoded, a VIN specifies the country and year of manufacture; make, model, and serial number; assembly plant; and even some equipment specifications. VINs are normally located in several locations on a car, but the most common places are in the door frame of the front doors, on the engine itself, around the steering wheel, or on the dash near the window. What do you think of the VIN as a method of vehicle identification? How do you reconcile it with the recommendation to use meaningless identifiers? If you were consulted on a new VIN system, what would advise? |
The seven habits of highly effective data modelers
There is often a large gap between the performance of average and expert data modelers. An insight into the characteristics that make some data modelers more skillful than others should improve your data modeling capabilities.
Immerse
Find out what the client wants by immersing yourself in the task environment. Spend some time following the client around and participate in daily business. Firsthand experience of the problem will give you a greater understanding of the client’s requirements. Observe, ask questions, reflect, and talk to a wide variety of people (e.g., managers, operations personnel, customers, and suppliers). The more you learn about the problem, the better equipped you are to create a high-fidelity data model.
Challenge
Challenge existing assumptions; dig out the exceptions. Test the boundaries of the data model. Try to think about the business problem from different perspectives (e.g., how might the industry leader tackle this problem?). Run a brainstorming session with the client to stimulate the search for breakthrough solutions.
Generalize
Reduce the number of entities whenever possible by using generalized structures (remember the Art Collection model) to simplify the data model. Simpler data models are usually easier to understand and less costly to implement. Expert data modelers can see beyond surface differences to discern the underlying similarities of seemingly different entities.
Test
Test the data model by reading it to yourself and several people intimately familiar with the problem. Test both directions of every relationship (e.g., a farmer has many cows and a cow belongs to only one farmer). Build a prototype so that the client can experiment and learn with a concrete model. Testing is very important because it costs very little to fix a data model but a great deal to repair a system based on an incorrect data model.
Limit
Set reasonable limits to the time and scope of data modeling. Don’t let the data modeling phase continue forever. Discover the boundaries early in the project and stick to these unless there are compelling reasons to extend the project. Too many projects are allowed to expand because it is easier to say yes than no. In the long run, however, you do the client a disservice by promising too much and extending the life of the project. Determine the core entities and attributes that will solve most of the problems, and confine the data model to this core. Keep sight of the time and budget constraints of the project.
Integrate
Step back and reflect on how your project fits with the organization’s information architecture. Integrate with existing systems where feasible and avoid duplication. How does your data model fit with the corporate data model and those of other projects? Can you use part of an existing data model? A skilled data modeler has to see both the fine-grained detail of a project data model and the big picture of the corporate data resource.
Complete
Good data modelers don’t leave data models ill-defined. All entities, attributes, and relationships are carefully defined, ambiguities are resolved, and exceptions are handled. Because the full value of a data model is realized only when the system is complete, the data modeler should stay involved with the project until the system is implemented. The data modeler, who generally gets involved in the project from its earliest days, can provide continuity through the various phases and ensure the system solves the problem.
Summary
Data modeling is both a technique for modeling data and its relationships and a graphical representation of a database. It communicates a database’s design. The goal is to identify the facts that must be stored in a database. Building a data model is a partnership between a client, a representative of the eventual owners of the database, and a designer. The building blocks are an entity, attribute, identifier, and relationship. A well-formed data model, which means the construction rules have been obeyed, clearly communicates information to the client. A high-fidelity data model faithfully describes the world it represents.
A data model is an evolving representation. Each change should be an incremental improvement in quality. The quality of a data model can be determined only by understanding the context in which it will be used. A data model can model historical data relationships just as readily as current ones. Cardinality specifies the precise multiplicity of a relationship. Modality indicates whether a relationship is optional or mandatory. The five different types of entities are independent, dependent, associative, aggregate, and subordinate. Expect a data model to expand and contract. A data model has no ordering. Introduce an attribute if ordering is required. An attribute must have the same meaning for every instance. An attribute is the smallest piece of data that will conceivably form part of a query. Synonyms are words that have the same meaning; homonyms are words that sound the same but have different meanings. Identifiers should generally have no meaning. Highly effective data modelers immerse, challenge, generalize, test, limit, integrate, and complete.
Key terms and concepts
| Aggregate entity | Homonym |
| Aggregation | Identifier |
| Associative entity | Independent entity |
| Attribute | Instance |
| Cardinality | Mandatory |
| Composite aggregation | Modality |
| Data model | Modeling |
| Data model quality | Optional |
| Dependent entity | Relationship |
| Determinant | Relationship descriptor |
| Domain | Relationship label |
| Entity | Shared aggregation |
| Generalization | Synonym |
| High-fidelity image |
Exercises
Short answers
What is data modeling?
What is a useful technique for identifying entities in a written description of a data modeling problem?
When do you label relationships?
When is a data model well formed, and when is it high-fidelity?
How do you handle exceptions when data modeling?
Describe the different types of entities.
Why might a data model grow?
Why might a data model contract?
How do you indicate ordering of instances in a data model?
What is the difference between a synonym and a homonym?
Data modeling
Create a data model from the following narratives, which are sometimes intentionally incomplete. You will have to make some assumptions. Make certain you state these alongside your data model. Define the identifier(s) and attributes of each entity.
The president of a book wholesaler has told you that she wants information about publishers, authors, and books.
A university has many subject areas (e.g., MIS, Romance languages). Professors teach in only one subject area, but the same subject area can have many professors. Professors can teach many different courses in their subject area. An offering of a course (e.g., Data Management 457, French 101) is taught by only one professor at a particular time.
Kids’n’Vans retails minivans for a number of manufacturers. Each manufacturer offers several models of its minivan (e.g., SE, LE, GT). Each model comes with a standard set of equipment (e.g., the Acme SE comes with wheels, seats, and an engine). Minivans can have a variety of additional equipment or accessories (radio, air-conditioning, automatic transmission, airbag, etc.), but not all accessories are available for all minivans (e.g., not all manufacturers offer a driver’s side airbag). Some sets of accessories are sold as packages (e.g., the luxury package might include stereo, six speakers, cocktail bar, and twin overhead foxtails).
Steve operates a cinema chain and has given you the following information:
“I have many cinemas. Each cinema can have multiple theaters. Movies are shown throughout the day starting at 11 a.m. and finishing at 1 a.m. Each movie is given a two-hour time slot. We never show a movie in more than one theater at a time, but we do shift movies among theaters because seating capacity varies. I am interested in knowing how many people, classified by adults and children, attended each showing of a movie. I vary ticket prices by movie and time slot. For instance, Lassie Get Lost is 50 cents for everyone at 11 a.m. but is 75 cents at 11 p.m.”
A university gymnastics team can have as many as 10 gymnasts. The team competes many times during the season. A meet can have one or more opponents and consists of four events: vault, uneven bars, beam, and floor routine. A gymnast can participate in all or some of these events though the team is limited to five participants in any event.
A famous Greek shipping magnate, Stell, owns many container ships. Containers are collected at one port and delivered to another port. Customers pay a negotiated fee for the delivery of each container. Each ship has a sailing schedule that lists the ports the ship will visit over the next six months. The schedule shows the expected arrival and departure dates. The daily charge for use of each port is also recorded.
A medical center employs several physicians. A physician can see many patients, and a patient can be seen by many physicians, though not always on the one visit. On any particular visit, a patient may be diagnosed to have one or more illnesses.
A telephone company offers a 10 percent discount to any customer who phones another person who is also a customer of the company. To be eligible for the discount, the pairing of the two phone numbers must be registered with the telephone company. Furthermore, for billing purposes, the company records both phone numbers, start time, end time, and date of call.
Global Trading (GT), Inc. is a conglomerate. It buys and sells businesses frequently and has difficulty keeping track of what strategic business units (SBUs) it owns, in what nations it operates, and what markets it serves. For example, the CEO was recently surprised to find that GT owns 25 percent of Dundee’s Wild Adventures, headquartered in Zaire, that has subsidiaries operating tours of Australia, Zaire, and New York. You have been commissioned to design a database to keep track of GT’s businesses. The CEO has provided you with the following information:
SBUs are headquartered in one country, not necessarily the United States. Each SBU has subsidiaries or foreign agents, depending on local legal requirements, in a number of countries. Each subsidiary or foreign agent operates in only one country but can operate in more than one market. GT uses the standard industrial code (SIC) to identify a market (e.g., newspaper publishing). The SIC is a unique four-digit code.
While foreign agents operate as separate legal entities, GT needs to know in what countries and markets they operate. On the other hand, subsidiaries are fully or partly owned by GT, and it is important for GT to know who are the other owners of any subsidiary and what percentage of the subsidiary they own. It is not unusual for a corporation to have shares in several of GT’s subsidiary companies and for several corporations to own a portion of a subsidiary. Multiple ownership can also occur at the SBU level.
A real estate investment company owns many shopping malls. Each mall contains many shops. To encourage rental of its shops, the company gives a negotiated discount to retailers who have shops in more than one mall. Each shop generates an income stream that can vary from month to month because rental is based on a flat rental charge and a negotiated percentage of sales revenue. Also, each shop has monthly expenses for scheduled and unscheduled maintenance. The company uses the data to compute its monthly net income per square meter for each shop and for ad hoc querying.
Draw a data model for the following table taken from a magazine that evaluates consumer goods. The reports follow a standard fashion of listing a brand and model, price, overall score, and then an evaluation of a series of attributes, which can vary with the product. For example, the sample table evaluates stereo systems. A table for evaluating microwave ovens would have a similar layout, but different features would be reported (e.g., cooking quality).
| Brand and model | Price | Overall score | Sound quality | Taping quality | FM tuning | CD handling | Ease of use |
|---|---|---|---|---|---|---|---|
| Phillips SC-AK103 | 140 | 62 | Very good | Good | Very good | Excellent | Fair |
| Panasonic MC-50 | 215 | 55 | Good | Good | Very good | Very good | Good |
| Rio G300 | 165 | 38 | Good | Good | Fair | Very good | Poor |
- Draw a data model for the following freight table taken from a mail order catalog. All values are in USD.
| Merchandise subtotals | Regular delivery | Rush delivery | Express delivery |
|---|---|---|---|
| 7-10 days | 4-5 business days | 1-2 business days | |
| Up to 30.00 | 4.95 | 9.95 | 12.45 |
| 30.01-65.00 | 6.95 | 11.95 | 15.45 |
| 65.01-125.00 | 8.95 | 13.95 | 20.45 |
| 125.01+ | 9.95 | 15.95 | 25.45 |
Roberto Franzosi, “On Quantitative Narrative Analysis,” in Varieties of Narrative Analysis, ed. James A. Holstein and Jaber F. Gubrium (SAGE Publications, Inc., 2012), 75–96.↩︎