Short Answers
- 1.
What is normalization and what is its goal?
Normalization provides a theoretical base for defining the desirable properties of
relations. It is the process for checking the quality of a database design.
- 3.
How do E-R and IDEF1X differ from the data modeling method of this text?
The E-R modeling approach differs from the data modeling approach used in this text
in that m:m relationships are not shown as intersection entities. There are some
graphical differences: attributes are listed in ovals attached to the entity and
relationships are symbolized by a diamond. Otherwise, the modeling technique is
basically the same.
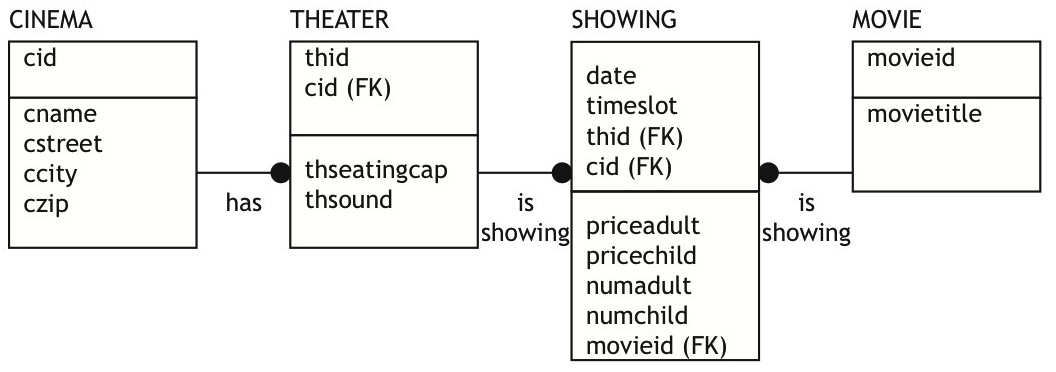
The IDEF1X modeling technique is also only slightly different from the modeling
technique described in the text: relationships are always labeled and 1:m
relationships are symbolized with a dot instead of a crow's foot. Table names are
written on top of the entity box, primary keys are separated from the rest of the
attributes with a line, and alternate keys and inversion entries are indicated in
the model.
Data Modeling
Using normalization, E-R, or IDEF1X, create data models from the following narratives, which are sometimes intentionally incomplete. You will have to make some assumptions. Make certain you state these alongside your data model. Define the identifier(s) and attributes of each entity.
- 2.
A university has many subject areas (e.g., MIS, Romance languages). Professors
teach in only one subject area, but the same subject area can have many professors.
Professors can teach many different courses in their subject area. An offering of a
course (e.g., Data Management 457, French 101) is taught by only one professor at a
particular time.
For the data model according to the book's data modeling approach, see Chapter 7
modeling exercise 2.
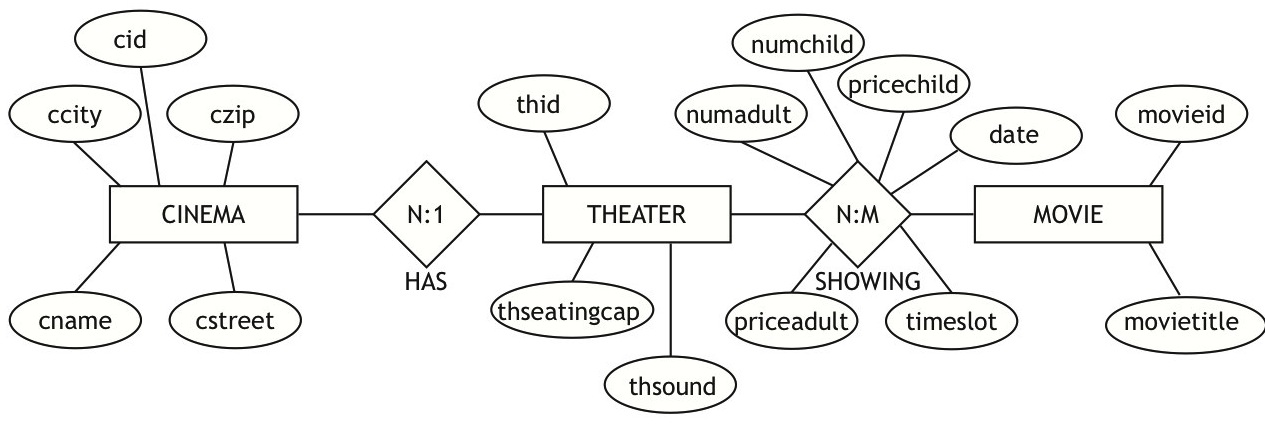
E-R diagram:

IDEF1X:

- 4.
Steve operates a cinema chain and has given you the following information:
“I have many cinemas. Each cinema can have multiple theaters. Movies are shown
throughout the day starting at 11 a.m. and finishing at 1 a.m. Each movie is given a
two-hour time slot. We never show a movie in more than one theater at a time, but we do
shift movies among theaters because seating capacity varies. I am interested in knowing
how many people, classified by adults and children, attended each showing of a movie. I
vary ticket prices by movie and time slot. For instance, Lassie Get Lost at 11 a.m. is
50 cents for everyone but is 75 cents at 11 p.m.”
For the data model according to the book's data modeling approach, see Chapter 7
modeling exercise 4.
E-R diagram:
IDEF1X:
This page is part of the promotional and support material for Data Management (open edition) by Richard T. Watson
For questions and comments please contact the author |
Date revised:
17-Oct-2022
